the wisconsin tornado outbreak of 23 june 2004 - National Weather ...
the wisconsin tornado outbreak of 23 june 2004 - National Weather ...
the wisconsin tornado outbreak of 23 june 2004 - National Weather ...

You also want an ePaper? Increase the reach of your titles
YUMPU automatically turns print PDFs into web optimized ePapers that Google loves.
Wisconsin Tornado Outbreak<br />
cloud model. However, Johns et al. (1993) examined 242<br />
proximity soundings <strong>of</strong> F2 and greater <strong>tornado</strong>es and<br />
revealed that 47% occurred with BRNs less than 8 and<br />
nearly 79% less than 20. Riley and Colquhoun (1990) found<br />
that nearly 50% <strong>of</strong> <strong>the</strong>ir cases had BRN less than 21 for all<br />
ranges <strong>of</strong> <strong>the</strong> F-scale. Johns et al. (1993) noted that <strong>the</strong><br />
majority <strong>of</strong> <strong>the</strong>ir tornadic supercells were associated with<br />
“complex multicellular convective structures”, such as bow<br />
echoes, lines, clusters, and spiral bands. Moller et al. (1990,<br />
1994) and Doswell et al. (1990) recognized many <strong>of</strong> <strong>the</strong>se<br />
storms as HP supercells, with common characteristics <strong>of</strong> (1)<br />
rotation, (2) a “distinctive” (Forbes 1981) appearance on<br />
reflectivity despite being surrounded by o<strong>the</strong>r convection,<br />
and (3) containing a large amount <strong>of</strong> precipitation in <strong>the</strong><br />
mesocyclone. Since HP supercells produced <strong>the</strong> majority<br />
<strong>of</strong> severe wea<strong>the</strong>r and <strong>tornado</strong>es on <strong>23</strong> June <strong>2004</strong>, fur<strong>the</strong>r<br />
discussion is warranted.<br />
More recent research on supercell type (Rasmussen and<br />
Straka 1998) focused on storm-relative (SR) upper flow.<br />
Rasmussen and Straka (1998) found SR upper flow greater<br />
than 30 m s -1 supported low precipitation (LP) supercells<br />
while SR flow <strong>of</strong> less than 12 m s -1 supported HP supercells.<br />
SR upper flow from 12-30 m s -1 and 0-3 km SRH less than<br />
250 m 2 s -2 supported LP supercells while <strong>the</strong> same SR upper<br />
flow and 0-3 km SRH greater than 250 m 2 s -2 trended toward<br />
HP supercells. However, it was stressed that storm mergers<br />
and seeding from o<strong>the</strong>r storms may lead to HP supercells<br />
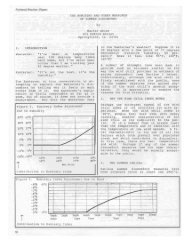
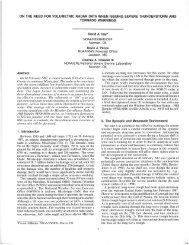
Fig. 10. Blue River, WI pr<strong>of</strong>iler data. Note increase in 0-2<br />
km winds (kt) from 2100 UTC to 0000 UTC.<br />
and that this process may dominate over SR upper flow.<br />
On <strong>23</strong> June <strong>2004</strong> <strong>the</strong>re were at least a half-dozen<br />
tornadic HP supercells that were embedded, surrounded, or<br />
merged with o<strong>the</strong>r convective cells very similar to <strong>the</strong> cases<br />
discussed by Johns et al. (1993) that had low BRN. The HP<br />
supercell type in this event was most likely a result from<br />
seeding due to <strong>the</strong> close spacing <strong>of</strong> <strong>the</strong> storms (Fig. 5c). The<br />
long-track HP supercell that produced six <strong>tornado</strong>es had 10<br />
km SR flow <strong>of</strong> 20 m s -1 and 0-3 km SRH <strong>of</strong> 260 m 2 s -2 (Fig. 14).<br />
This matches <strong>the</strong> SR upper flow and SRH that Rasmussen and<br />
Straka (1998) found for HP supercells. However, <strong>the</strong> long<br />
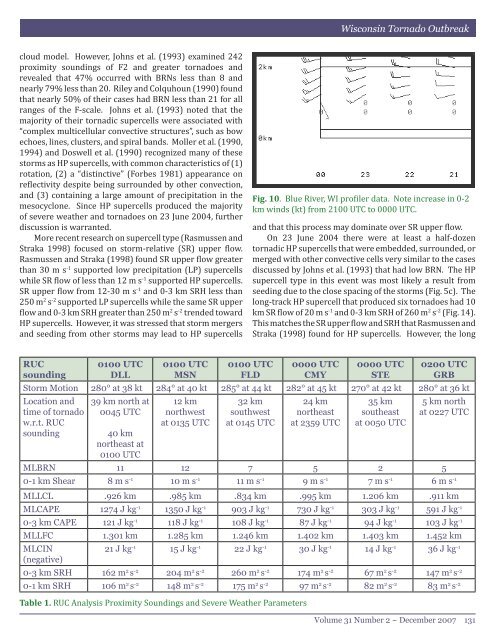
RUC<br />
sounding<br />
0100 UTC<br />
DLL<br />
0100 UTC<br />
MSN<br />
0100 UTC<br />
FLD<br />
0000 UTC<br />
CMY<br />
0000 UTC<br />
STE<br />
0200 UTC<br />
GRB<br />
Storm Motion 280° at 38 kt 284° at 40 kt 285° at 44 kt 282° at 45 kt 270° at 42 kt 280° at 36 kt<br />
Location and<br />
time <strong>of</strong> <strong>tornado</strong><br />
w.r.t. RUC<br />
sounding<br />
39 km north at<br />
0045 UTC<br />
40 km<br />
nor<strong>the</strong>ast at<br />
0100 UTC<br />
12 km<br />
northwest<br />
at 0135 UTC<br />
32 km<br />
southwest<br />
at 0145 UTC<br />
24 km<br />
nor<strong>the</strong>ast<br />
at <strong>23</strong>59 UTC<br />
35 km<br />
sou<strong>the</strong>ast<br />
at 0050 UTC<br />
5 km north<br />
at 0227 UTC<br />
MLBRN 11 12 7 5 2 5<br />
0-1 km Shear 8 m s -1 10 m s -1 11 m s -1 9 m s -1 7 m s -1 6 m s -1<br />
MLLCL .926 km .985 km .834 km .995 km 1.206 km .911 km<br />
MLCAPE 1274 J kg -1 1350 J kg -1 903 J kg -1 730 J kg -1 303 J kg -1 591 J kg -1<br />
0-3 km CAPE 121 J kg -1 118 J kg -1 108 J kg -1 87 J kg -1 94 J kg -1 103 J kg -1<br />
MLLFC 1.301 km 1.285 km 1.246 km 1.402 km 1.403 km 1.452 km<br />
MLCIN<br />
21 J kg -1 15 J kg -1 22 J kg -1 30 J kg -1 14 J kg -1 36 J kg -1<br />
(negative)<br />
0-3 km SRH 162 m 2 s -2 204 m 2 s -2 260 m 2 s -2 174 m 2 s -2 67 m 2 s -2 147 m 2 s -2<br />
0-1 km SRH 106 m 2 s -2 148 m 2 s -2 175 m 2 s -2 97 m 2 s -2 82 m 2 s -2 83 m 2 s -2<br />
Table 1. RUC Analysis Proximity Soundings and Severe Wea<strong>the</strong>r Parameters<br />
Volume 31 Number 2 ~ December 2007 131