The humisery and other measures of summer discomfort - National ...
The humisery and other measures of summer discomfort - National ...
The humisery and other measures of summer discomfort - National ...

You also want an ePaper? Increase the reach of your titles
YUMPU automatically turns print PDFs into web optimized ePapers that Google loves.
<strong>National</strong> Weather Digest<br />
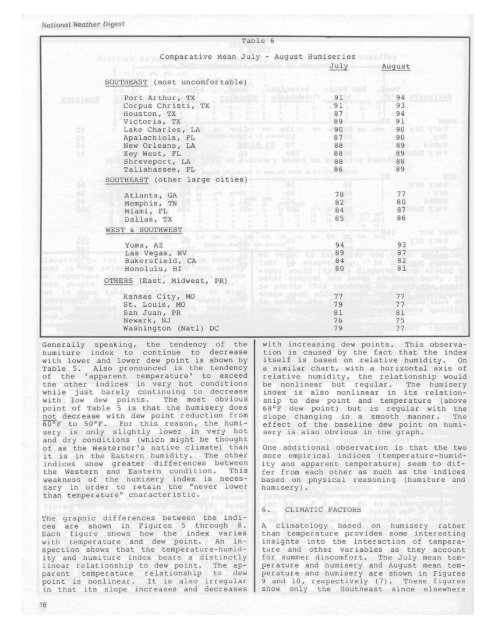
Table 6<br />
Comparative Mean July -<br />
August Humiseries<br />
July<br />
August<br />
SOUTHEAST<br />
(most uncomfortable)<br />
Port Arthur, TX<br />
Corpus Christi, TX<br />
Houston, TX<br />
Victoria, TX<br />
Lake Charles, LA<br />
Apalach iola, FL<br />
New Orleans, LA<br />
Key West, FL<br />
Shreveport, LA<br />
Tallahassee, FL<br />
SOUTHEAST (<strong>other</strong> large cities)<br />
Atlanta, GA<br />
Memphis, TN<br />
Miami, FL<br />
Dallas, TX<br />
WEST & SOUTHWEST<br />
Yuma, AZ<br />
Las Vegas, NV<br />
Bakersfield, CA<br />
Honolulu, HI<br />
OTHERS (East, Midwest, PRJ<br />
Kansas City, MO<br />
St. Louis, MO<br />
San Juan, PR<br />
Newark, NJ<br />
Washington (Natl) DC<br />
91<br />
91<br />
87<br />
89<br />
90<br />
87<br />
88<br />
88<br />
88<br />
86<br />
78<br />
82<br />
84<br />
85<br />
94<br />
89<br />
84<br />
80<br />
77<br />
79<br />
81<br />
76<br />
79<br />
94<br />
93<br />
94<br />
91<br />
90<br />
90<br />
89<br />
89<br />
88<br />
89<br />
77<br />
80<br />
87<br />
86<br />
93<br />
87<br />
82<br />
81<br />
77<br />
77<br />
81<br />
75<br />
77<br />
Generally speaking, the tendency <strong>of</strong> the<br />
humiture index to continue to decrease<br />
with lower <strong>and</strong> lower dew point is shown by<br />
Table s. Also pr onounced is the tendency<br />
<strong>of</strong> the 'apparent temperature' to exceed<br />
the <strong>other</strong> indices in very hot conditions<br />
while just barely continuing to decrease<br />
with low dew points. <strong>The</strong> most obvious<br />
point <strong>of</strong> Table 5 is that the <strong>humisery</strong> does<br />
not decrease with dew point reduction from<br />
60°F to 50°F. For this reason, the <strong>humisery</strong><br />
is only slightly lower in very hot<br />
<strong>and</strong> dry conditions (which might be thought<br />
<strong>of</strong> as the Westerner's native climate) than<br />
it is in the Eastern humidity. <strong>The</strong> <strong>other</strong><br />
indices show greater differences between<br />
the Western <strong>and</strong> Eastern condition. This<br />
weakness <strong>of</strong> the <strong>humisery</strong> index is necessary<br />
in order to retain the "never lower<br />
than temperature" characteristic.<br />
<strong>The</strong> graphic differences between the indices<br />
are shown in Figures 5 through 8.<br />
Each figure shows how the index varies<br />
with temperature <strong>and</strong> dew point. An inspection<br />
shows that the temperature-humidity<br />
<strong>and</strong> humiture index bears a distinctly<br />
linear relationship to dew point. <strong>The</strong> apparent<br />
temperature relationship to dew<br />
point is nonlinear. It is also irregular<br />
in that its slope increases <strong>and</strong> decreases<br />
with increasing dew points. This observation<br />
is caused by the fact that the index<br />
itself is based on relative humidity. On<br />
a similar chart, with a horizontal axis <strong>of</strong><br />
relative humidity, the relationship would<br />
be nonlinear but regular. <strong>The</strong> <strong>humisery</strong><br />
index is also nonlinear in its relationship<br />
to dew point <strong>and</strong> temperature (above<br />
68°F dew point) but is regular with the<br />
slope changing in a smooth manner. <strong>The</strong><br />
effect <strong>of</strong> the baseline dew point on <strong>humisery</strong><br />
is also obvious in the graph.<br />
One additional observation is that the two<br />
more empir ical indices (temperature-humidity<br />
<strong>and</strong> apparent temperature) seem to differ<br />
from each <strong>other</strong> as much as the indices<br />
based on physical reasoning (humiture <strong>and</strong><br />
<strong>humisery</strong>) .<br />
6. CLIMATIC FACTORS<br />
A climatology based on <strong>humisery</strong> rather<br />
than temperature provides some interesting<br />
insights into the interaction <strong>of</strong> temperature<br />
<strong>and</strong> <strong>other</strong> var iables as they account<br />
for <strong>summer</strong> <strong>discomfort</strong>. <strong>The</strong> July mean temperature<br />
<strong>and</strong> <strong>humisery</strong> <strong>and</strong> August mean temperature<br />
<strong>and</strong> <strong>humisery</strong> are shown in Figures<br />
9 <strong>and</strong> 10, respectively (7). <strong>The</strong>se figures<br />
show only the Southeast since elsewhere<br />
16