Using WSR-88D reflectivity data for the prediction of cloud-to-ground ...
Using WSR-88D reflectivity data for the prediction of cloud-to-ground ...
Using WSR-88D reflectivity data for the prediction of cloud-to-ground ...

Create successful ePaper yourself
Turn your PDF publications into a flip-book with our unique Google optimized e-Paper software.
Volume 27 December 2003 37<br />
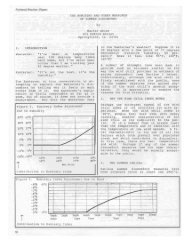
'1<br />
~ ..<br />
~<br />
CI<br />
'Qj<br />
::t:<br />
24<br />
23<br />
22<br />
21<br />
20<br />
19<br />
18<br />
17<br />
i-------;:=======::;-------=--r 7.3<br />
f---_____ o~+<br />
• T=-10C<br />
7<br />
El<br />
EiI T=-15C f-------- --+ 6.7<br />
El<br />
··- ·- --UJ----x--<br />
f-. --~.~ ~. -------------<br />
o<br />
-~<br />
--~ - ~A<br />
.- -+------ .--.------ - - -----'i,.r-.--<br />
... _. .._-- --. - ..- .. . _---<br />
16 - -_._----_._-_._ ._ .._-_. .. . ... . • ,. 11' .. " __ __._. __._.<br />
~ 4.9<br />
15 ._ ______._________._______-A 4.6<br />
14 +----.-------.------,r---.----,-----r---+ 4.3<br />
7/28/2001 9/16/2001 11/5/2001 12125/2001 2/13/2002 4/412002 5/24/2002 7/13/2002<br />
Date<br />
6.4 ~<br />
E<br />
6.1 =-<br />
5.8 1:<br />
5.5 .~<br />
5.2 ::t:<br />
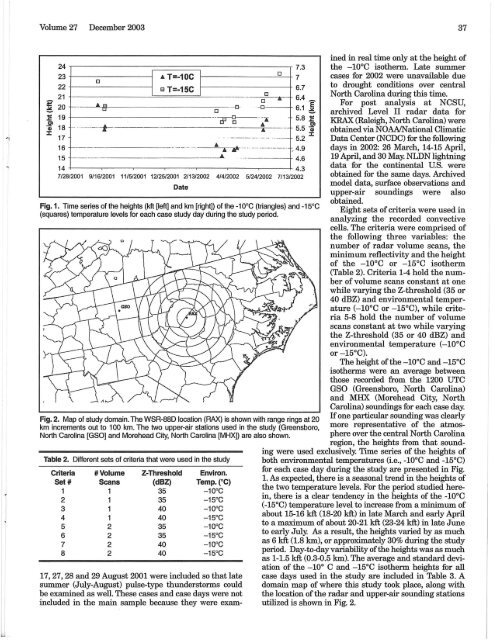
Fig. 1. Time series <strong>of</strong> <strong>the</strong> heights (kft [left] and km [right]) <strong>of</strong> <strong>the</strong> -10°C (triangles) and -15°C<br />
(squares) temperature levels <strong>for</strong> each case study day during <strong>the</strong> study period.<br />
Fig. 2. Map <strong>of</strong> study domain. The <strong>WSR</strong>-<strong>88D</strong> location (RAX) is shown with range rings at 20<br />
km increments out <strong>to</strong> 100 km. The two upper-air stations used in <strong>the</strong> study (Greensboro,<br />
North Carolina [GSO] and Morehead City, North Carolina [MHX]) are also shown.<br />
Table 2. Different sets <strong>of</strong> criteria that were used in <strong>the</strong> study<br />
Criteria # Volume Z-Threshold Environ.<br />
Set # Scans (dBZ) Temp. ("C)<br />
1 1 35 -10°C<br />
2 1 35 -15°C<br />
3 1 40 -10°C<br />
4 1 40 -15°C<br />
5 2 35 -10°C<br />
6 2 35 -15°C<br />
7 2 40 -10°C<br />
8 2 40 -15°C<br />
ined in real time only at <strong>the</strong> height <strong>of</strong><br />
<strong>the</strong> -lOoC iso<strong>the</strong>rm. Late summer<br />
cases <strong>for</strong> 2002 were unavailable due<br />
<strong>to</strong> drought conditions over central<br />
North Carolina during this time.<br />
For post analysis at NCSU,<br />
archived Level II radar <strong>data</strong> <strong>for</strong><br />
KRAX (Raleigh, North Carolina) were<br />
obtained via NOAAIN ational Climatic<br />
Data Center (NCDC) <strong>for</strong> <strong>the</strong> following<br />
days in 2002: 26 March, 14-15 April,<br />
19 April, and 30 May. NLDN lightning<br />
<strong>data</strong> <strong>for</strong> <strong>the</strong> continental u.s. were<br />
obtained <strong>for</strong> <strong>the</strong> same days. Archived<br />
model <strong>data</strong>, surface observations and<br />
upper-air soundings were also<br />
obtained.<br />
Eight sets <strong>of</strong> criteria were used in<br />
analyzing <strong>the</strong> recorded convective<br />
cells. The criteria were comprised <strong>of</strong><br />
<strong>the</strong> following three variables: <strong>the</strong><br />
number <strong>of</strong> radar volume scans, <strong>the</strong><br />
minimum <strong>reflectivity</strong> and <strong>the</strong> height<br />
<strong>of</strong> <strong>the</strong> -lOoC or -15°C iso<strong>the</strong>rm<br />
(Table 2). Criteria 1-4 hold <strong>the</strong> number<br />
<strong>of</strong> volume scans constant at one<br />
while varying <strong>the</strong> Z-threshold (35 or<br />
40 dBZ) and environmental temperature<br />
(-lOOC or -15°C), while criteria<br />
5-8 hold <strong>the</strong> number <strong>of</strong> volume<br />
scans constant at two while varying<br />
<strong>the</strong> Z-threshold (35 or 40 dBZ) and<br />
environmental temperature (-lOOC<br />
or -15°C).<br />
The height <strong>of</strong> <strong>the</strong> -lOoC and -15°C<br />
iso<strong>the</strong>rms were an average between<br />
those recorded from <strong>the</strong> 1200 UTC<br />
GSO (Greensboro, North Carolina)<br />
and MHX (Morehead City, North<br />
Carolina) soundings <strong>for</strong> each case day.<br />
If one particular sounding was clearly<br />
more representative <strong>of</strong> <strong>the</strong> atmosphere<br />
over <strong>the</strong> central North Carolina<br />
region, <strong>the</strong> heights from that sound<br />
17, 27, 28 and 29 August 2001 were included so that late<br />
summer (July-August) pulse-type thunders<strong>to</strong>rms could<br />
be examined as well. These cases and case days were not<br />
included in <strong>the</strong> main sample because <strong>the</strong>y were examing<br />
were used exclusively. Time series <strong>of</strong> <strong>the</strong> heights <strong>of</strong><br />
both environmental temperatures (i.e., -lOoC and -15°C)<br />
<strong>for</strong> each case day during <strong>the</strong> study are presented in Fig.<br />
1. As expected, <strong>the</strong>re is a seasonal trend in <strong>the</strong> heights <strong>of</strong><br />
<strong>the</strong> two temperature levels. For <strong>the</strong> period studied herein,<br />
<strong>the</strong>re is a clear tendency in <strong>the</strong> heights <strong>of</strong><strong>the</strong> -lOoC<br />
(-15°C) temperature level <strong>to</strong> increase from a minimum <strong>of</strong><br />
about 15-16 kit (18-20 kit) in late March and early April<br />
<strong>to</strong> a maximum <strong>of</strong> about 20-21 kit (23-24 kit) in late June<br />
<strong>to</strong> early July. As a result, <strong>the</strong> heights varied by as much<br />
as 6 kit (1.8 km), or approximately 30% during <strong>the</strong> study<br />
period. Day-<strong>to</strong>-day variability <strong>of</strong> <strong>the</strong> heights was as much<br />
as 1-1.5 kit (0.3-0.5 km). The average and standard deviation<br />
<strong>of</strong> <strong>the</strong> _10° C and -15°C iso<strong>the</strong>rm heights <strong>for</strong> all<br />
case days used in <strong>the</strong> study are included in Table 3. A<br />
domain map <strong>of</strong> where this study <strong>to</strong>ok place, along with<br />
<strong>the</strong> location <strong>of</strong> <strong>the</strong> radar and upper-air sounding stations<br />
utilized is shown in Fig. 2.