a preliminary assessment of the wsr-88d hail detection algorithm's ...
a preliminary assessment of the wsr-88d hail detection algorithm's ...
a preliminary assessment of the wsr-88d hail detection algorithm's ...

Create successful ePaper yourself
Turn your PDF publications into a flip-book with our unique Google optimized e-Paper software.
Volume 22 Number 1 December 1997<br />
11<br />
The TDA contained in WATADS detects <strong>the</strong> Tornadic<br />
Vortex Signature (TVS) circulation pattern. The MA contained<br />
in WATADS detects <strong>the</strong> following circulations:<br />
Mesocyclone associated with a TVS (TORMES),<br />
Mesocyclone (MESO), Low-topped Mesocyclone (LOW<br />
TOP), Couplet (CPLT), Low-altitude Circulation<br />
(LOWALT), Long-range Circulation (2DFT), Weak<br />
Circulation (WKCIRC), 3D Weak Couplet (WKCPLT),<br />
Weak Low-altitude Circulation (WKLALT), and Weak<br />
Long-range Circulation (WK2DFT) (McKibben 1996).<br />
Of <strong>the</strong> above circulations, three were detected by <strong>the</strong><br />
WATADS algorithms in this study: MESO, WKCIRC, and<br />
WKCPLT.<br />
The operational WSR-88D Tornado Vortex Signature<br />
(TVS) Algorithm detects a Tornadic Vortex Signature<br />
(TVS) circulation pattern, while <strong>the</strong> Mesocyclone<br />
Algorithm detects Mesocyclone (MESO), 3-D Correlated<br />
Shear, and Uncorrelated Shear circulation patterns<br />
(Klazura and Imy 1993).<br />
Since storm rotation implies dynamic updraft forcing<br />
and a high degree <strong>of</strong> storm organization, severe <strong>hail</strong> should<br />
occur more frequently if a circulation is present.<br />
While <strong>the</strong> WATADS detected circulations and <strong>the</strong> operational<br />
WSR-88D circulations are defined differently, <strong>the</strong><br />
presence <strong>of</strong> any circulation may be an indicator <strong>of</strong> <strong>the</strong> presence<br />
<strong>of</strong> severe <strong>hail</strong>. Thus, <strong>the</strong> data were stratified by <strong>the</strong><br />
type <strong>of</strong> circulation present to look for an enhancement in<br />
<strong>the</strong> HDA's performance.<br />
If <strong>the</strong> HDA POSH and WSR-88D circulation signatures<br />
could be more closely correlated to <strong>the</strong> actual occurrence <strong>of</strong><br />
severe <strong>hail</strong>, <strong>the</strong>n <strong>the</strong> radar operator could issue severe<br />
thunderstorm warnings with a greater degree <strong>of</strong> confidence<br />
that <strong>the</strong> warnings would verify.<br />
Due to a lack <strong>of</strong> ground truth in data sparse areas, a separate<br />
evaluation <strong>of</strong> <strong>the</strong> <strong>algorithm's</strong> performance was completed<br />
for high population density counties within <strong>the</strong><br />
NWSFO CLE CWA (six counties with a population density<br />
~ 635 people per square mile) (Fig. 1). These six counties<br />
contained all <strong>the</strong> metropolitan areas with a population<br />
> 100,000 within <strong>the</strong> NWSFO CLE CWA.<br />
Preliminary findings by Witt at <strong>the</strong> NSSL (1997, personal<br />
communication) and Foster, Science Operations<br />
Officer (SOO) at NWSFO Fort Worth, Texas (FTW) (1997,<br />
personal communication) indicate that <strong>the</strong> NSSL HDA<br />
tends to overwarn in tropical environments. Thus, an evaluation<br />
was completed for high precipitable water (PW)<br />
events (PW values ~ 1.5 in.) to assess <strong>the</strong> HDA's performance<br />
in tropical airmasses.<br />
The Mean Absolute Error (MAE) as defined in equation<br />
(8) and Mean Error (ME), equation (9), were computed for<br />
all cells with a POSH ~ 50%, that could be correlated with<br />
a severe <strong>hail</strong> report. The 50% POSH threshold was chosen<br />
since it represents <strong>the</strong> mid-point <strong>of</strong> <strong>the</strong> probability scale.<br />
MAE =N·! 2, IHSF-HSo I<br />
ME = N·! 2, (HSF - HSo)<br />
Here, HSF is <strong>the</strong> forecast <strong>hail</strong> size and HSo is <strong>the</strong> observed<br />
<strong>hail</strong> size. The ME and MAE were also calculated only for<br />
<strong>the</strong> scan prior to each severe <strong>hail</strong> report if <strong>the</strong> above conditions<br />
were met.<br />
(8)<br />
(9)<br />
Next, <strong>the</strong> lead time (time from when <strong>the</strong> HDA indicated<br />
a POSH ~ 50% to <strong>the</strong> time <strong>of</strong><strong>the</strong> severe <strong>hail</strong>) was calculated<br />
for each event.<br />
Finally, <strong>the</strong> Probability <strong>of</strong> Detection (POD), False Alarm<br />
Ratio (FAR), and Critical Success Index (CS!) were calculated<br />
based upon a POSH ~ 50%.<br />
5. Performance Results<br />
Using <strong>the</strong> evaluation procedure given in Section 4, algorithm<br />
performance results were generated for all storm<br />
days anruyzed. Given that <strong>the</strong> results below are based on<br />
just 16 days from one severe wea<strong>the</strong>r season, <strong>the</strong> sample<br />
size should be taken into account when viewing <strong>the</strong> results<br />
<strong>of</strong>this study. The sample sizes for <strong>the</strong> 90% and 100% HDA<br />
POSH thresholds are especially limited, with just 10 and<br />
15 cases, respectively.<br />
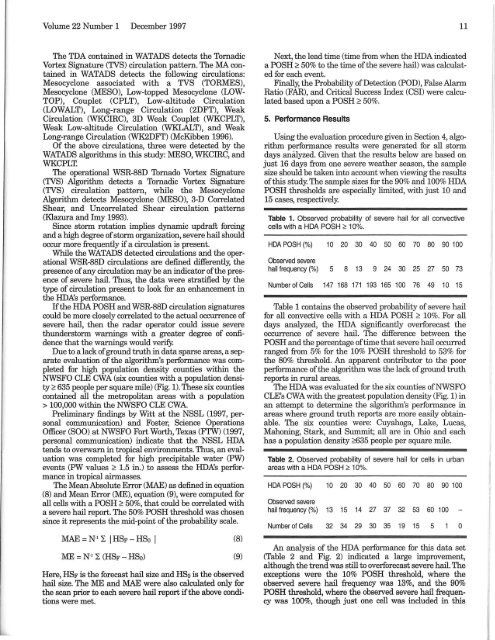
Table 1. Observed probability <strong>of</strong> severe <strong>hail</strong> for all convective<br />
cells with a HDA POSH ~ 10%.<br />
HDAPOSH (%) 10 20 30 40 50 60 70 80 90 100<br />
Observed severe<br />
<strong>hail</strong> frequency (%) 5 8 13 9 24 30 25 27 50 73<br />
Number <strong>of</strong> Cells 147 168 171 193 165 100 76 49 10 15<br />
Table 1 contains <strong>the</strong> observed probability <strong>of</strong> severe <strong>hail</strong><br />
for all convective cells with a HDA POSH ~ 10%. For all<br />
days analyzed, <strong>the</strong> HDA significantly overforecast <strong>the</strong><br />
occurrence <strong>of</strong> severe <strong>hail</strong>. The difference between <strong>the</strong><br />
POSH and <strong>the</strong> percentage <strong>of</strong>time that severe <strong>hail</strong> occurred<br />
ranged from 5% for <strong>the</strong> 10% POSH threshold to 53% for<br />
<strong>the</strong> 80% threshold. An apparent contributor to <strong>the</strong> poor<br />
performance <strong>of</strong> <strong>the</strong> algorithm was <strong>the</strong> lack <strong>of</strong> ground truth<br />
reports in rural areas.<br />
The HDA was evaluated for <strong>the</strong> six counties <strong>of</strong>NWSFO<br />
CLE's CWA with <strong>the</strong> greatest population density (Fig. 1) in<br />
an attempt to detennine <strong>the</strong> <strong>algorithm's</strong> performance in<br />
areas where ground truth reports are more easily obtainable.<br />
The six counties were: Cuyahoga, Lake, Lucas,<br />
Mahoning, Stark, and Summit; all are in Ohio and each<br />
has a population density ~635 people per square mile.<br />
Table 2. Observed probability <strong>of</strong> severe <strong>hail</strong> for cells in urban<br />
areas with a HDA POSH ~ 10%.<br />
HDAPOSH (%) 10 20 30 40 50 60 70 80 90 100<br />
Observed severe<br />
<strong>hail</strong> frequency (%) 13 15 14 27 37 32 53 60 100<br />
Number <strong>of</strong> Cells 32 34 29 30 35 19 15 5 0<br />
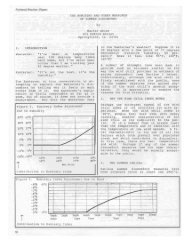
An analysis <strong>of</strong> <strong>the</strong> HDA performance for this data set<br />
(Table 2 and Fig. 2) indicated a large improvement,<br />
although <strong>the</strong> trend was still to overforecast severe <strong>hail</strong>. The<br />
exceptions were <strong>the</strong> 10% POSH threshold, where <strong>the</strong><br />
observed severe <strong>hail</strong> frequency was 13%, and <strong>the</strong> 90%<br />
POSH threshold, where <strong>the</strong> observed severe <strong>hail</strong> frequency<br />
was 100%, though just one cell was included in this