Southeast Europe
Southeast Europe
Southeast Europe

Create successful ePaper yourself
Turn your PDF publications into a flip-book with our unique Google optimized e-Paper software.
political and socio-economic condition characteristic to the monarchy was established, a<br />
new census operation was necessary. The next one was held in 1857 and offered<br />
information organised by confessional criteria (the census in 1857, 1996:15). In 1869<br />
only religion was mentioned, and the 1880 census did not include questions about<br />
nationality for political reasons (the Emperor of Austria and King of Hungary Franz<br />
Joseph ordered it); however it considered religion. The next censuses in 1890, 1900, and<br />
1910 provided information about both confessional and language structures of the<br />
population. When Transylvania and Romania united (1918), the authorities organised<br />
data collection in the Hungarian territory occupied by the Romanian army. This census<br />
contained information about religion and nationality. The census conducted in 1930<br />
gave answers about the population structure concerning nationality, religion, and<br />
language. The next two censuses made in 1941 and 1948 followed the same guidelines,<br />
but unfortunately, when the data from 1948 was processed, they considered only the<br />
mother tongue.<br />
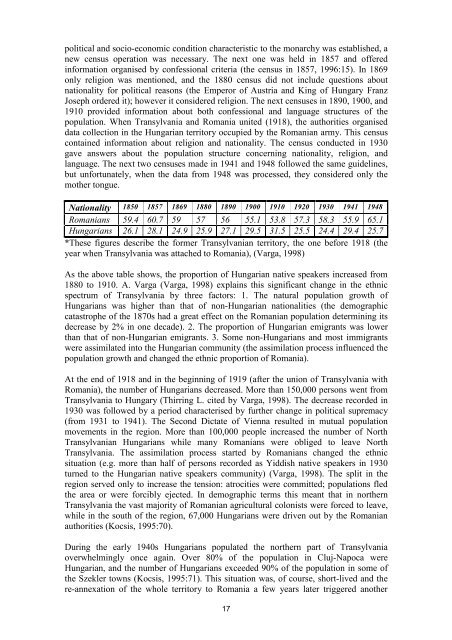
Nationality 1850 1857 1869 1880 1890 1900 1910 1920 1930 1941 1948<br />
Romanians 59.4 60.7 59 57 56 55.1 53.8 57.3 58.3 55.9 65.1<br />
Hungarians 26.1 28.1 24.9 25.9 27.1 29.5 31.5 25.5 24.4 29.4 25.7<br />
*These figures describe the former Transylvanian territory, the one before 1918 (the<br />
year when Transylvania was attached to Romania), (Varga, 1998)<br />
As the above table shows, the proportion of Hungarian native speakers increased from<br />
1880 to 1910. A. Varga (Varga, 1998) explains this significant change in the ethnic<br />
spectrum of Transylvania by three factors: 1. The natural population growth of<br />
Hungarians was higher than that of non-Hungarian nationalities (the demographic<br />
catastrophe of the 1870s had a great effect on the Romanian population determining its<br />
decrease by 2% in one decade). 2. The proportion of Hungarian emigrants was lower<br />
than that of non-Hungarian emigrants. 3. Some non-Hungarians and most immigrants<br />
were assimilated into the Hungarian community (the assimilation process influenced the<br />
population growth and changed the ethnic proportion of Romania).<br />
At the end of 1918 and in the beginning of 1919 (after the union of Transylvania with<br />
Romania), the number of Hungarians decreased. More than 150,000 persons went from<br />
Transylvania to Hungary (Thirring L. cited by Varga, 1998). The decrease recorded in<br />
1930 was followed by a period characterised by further change in political supremacy<br />
(from 1931 to 1941). The Second Dictate of Vienna resulted in mutual population<br />
movements in the region. More than 100,000 people increased the number of North<br />
Transylvanian Hungarians while many Romanians were obliged to leave North<br />
Transylvania. The assimilation process started by Romanians changed the ethnic<br />
situation (e.g. more than half of persons recorded as Yiddish native speakers in 1930<br />
turned to the Hungarian native speakers community) (Varga, 1998). The split in the<br />
region served only to increase the tension: atrocities were committed; populations fled<br />
the area or were forcibly ejected. In demographic terms this meant that in northern<br />
Transylvania the vast majority of Romanian agricultural colonists were forced to leave,<br />
while in the south of the region, 67,000 Hungarians were driven out by the Romanian<br />
authorities (Kocsis, 1995:70).<br />
During the early 1940s Hungarians populated the northern part of Transylvania<br />
overwhelmingly once again. Over 80% of the population in Cluj-Napoca were<br />
Hungarian, and the number of Hungarians exceeded 90% of the population in some of<br />
the Szekler towns (Kocsis, 1995:71). This situation was, of course, short-lived and the<br />
re-annexation of the whole territory to Romania a few years later triggered another<br />
17