2013 Apr 15 Annual Report 2012 - Phosphagenics
2013 Apr 15 Annual Report 2012 - Phosphagenics
2013 Apr 15 Annual Report 2012 - Phosphagenics

Create successful ePaper yourself
Turn your PDF publications into a flip-book with our unique Google optimized e-Paper software.
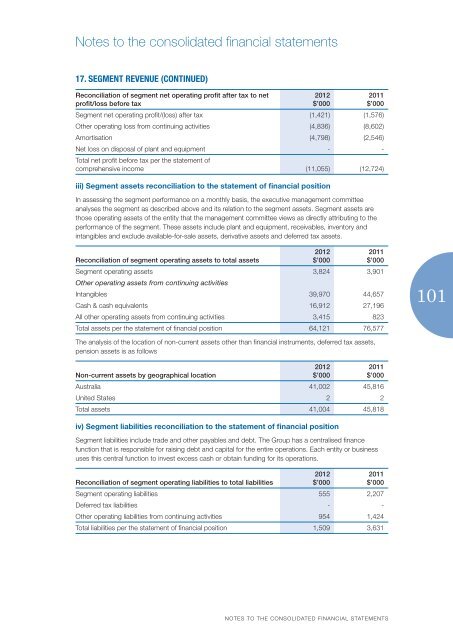
Notes to the consolidated fi nancial statements<br />
17. SEGMENT REVENUE (CONTINUED)<br />
Reconciliation of segment net operating profit after tax to net<br />
profit/loss before tax<br />
<strong>2012</strong><br />
$’000<br />
2011<br />
$’000<br />
Segment net operating profi t/(loss) after tax (1,421) (1,576)<br />
Other operating loss from continuing activities (4,836) (8,602)<br />
Amortisation (4,798) (2,546)<br />
Net loss on disposal of plant and equipment - -<br />
Total net profi t before tax per the statement of<br />
comprehensive income (11,055) (12,724)<br />
iii) Segment assets reconciliation to the statement of financial position<br />
In assessing the segment performance on a monthly basis, the executive management committee<br />
analyses the segment as described above and its relation to the segment assets. Segment assets are<br />
those operating assets of the entity that the management committee views as directly attributing to the<br />
performance of the segment. These assets include plant and equipment, receivables, inventory and<br />
intangibles and exclude available-for-sale assets, derivative assets and deferred tax assets.<br />
Reconciliation of segment operating assets to total assets<br />
<strong>2012</strong><br />
$’000<br />
2011<br />
$’000<br />
Segment operating assets 3,824 3,901<br />
Other operating assets from continuing activities<br />
Intangibles 39,970 44,657<br />
Cash & cash equivalents 16,912 27,196<br />
All other operating assets from continuing activities 3,4<strong>15</strong> 823<br />
Total assets per the statement of fi nancial position 64,121 76,577<br />
101<br />
The analysis of the location of non-current assets other than fi nancial instruments, deferred tax assets,<br />
pension assets is as follows<br />
Non-current assets by geographical location<br />
<strong>2012</strong><br />
$’000<br />
2011<br />
$’000<br />
Australia 41,002 45,816<br />
United States 2 2<br />
Total assets 41,004 45,818<br />
iv) Segment liabilities reconciliation to the statement of financial position<br />
Segment liabilities include trade and other payables and debt. The Group has a centralised fi nance<br />
function that is responsible for raising debt and capital for the entire operations. Each entity or business<br />
uses this central function to invest excess cash or obtain funding for its operations.<br />
Reconciliation of segment operating liabilities to total liabilities<br />
<strong>2012</strong><br />
$’000<br />
2011<br />
$’000<br />
Segment operating liabilities 555 2,207<br />
Deferred tax liabilities - -<br />
Other operating liabilities from continuing activities 954 1,424<br />
Total liabilities per the statement of fi nancial position 1,509 3,631<br />
NOTES TO THE CONSOLIDATED FINANCIAL STATEMENTS