Requirements for finger entrapment in European safety ... - ANEC
Requirements for finger entrapment in European safety ... - ANEC
Requirements for finger entrapment in European safety ... - ANEC

Create successful ePaper yourself
Turn your PDF publications into a flip-book with our unique Google optimized e-Paper software.
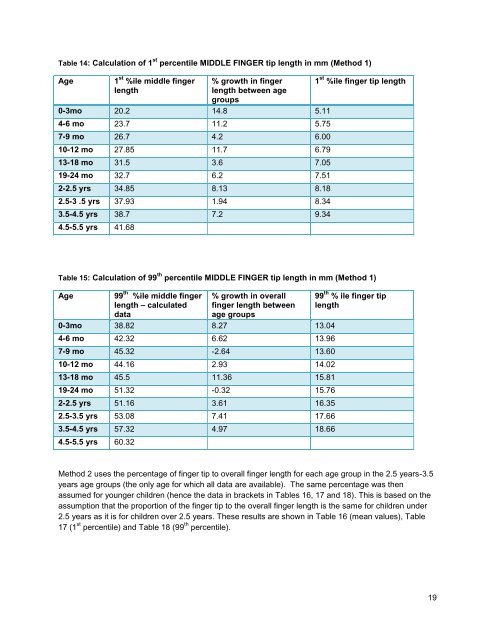
Table 14: Calculation of 1 st percentile MIDDLE FINGER tip length <strong>in</strong> mm (Method 1)<br />
Age<br />
1 st %ile middle <strong>f<strong>in</strong>ger</strong><br />
length<br />
% growth <strong>in</strong> <strong>f<strong>in</strong>ger</strong><br />
length between age<br />
groups<br />
0-3mo 20.2 14.8 5.11<br />
4-6 mo 23.7 11.2 5.75<br />
7-9 mo 26.7 4.2 6.00<br />
10-12 mo 27.85 11.7 6.79<br />
13-18 mo 31.5 3.6 7.05<br />
19-24 mo 32.7 6.2 7.51<br />
2-2.5 yrs 34.85 8.13 8.18<br />
2.5-3 .5 yrs 37.93 1.94 8.34<br />
3.5-4.5 yrs 38.7 7.2 9.34<br />
4.5-5.5 yrs 41.68<br />
1 st %ile <strong>f<strong>in</strong>ger</strong> tip length<br />
Table 15: Calculation of 99 th percentile MIDDLE FINGER tip length <strong>in</strong> mm (Method 1)<br />
Age 99 th %ile middle <strong>f<strong>in</strong>ger</strong><br />
length – calculated<br />
data<br />
% growth <strong>in</strong> overall<br />
<strong>f<strong>in</strong>ger</strong> length between<br />
age groups<br />
0-3mo 38.82 8.27 13.04<br />
4-6 mo 42.32 6.62 13.96<br />
7-9 mo 45.32 -2.64 13.60<br />
10-12 mo 44.16 2.93 14.02<br />
13-18 mo 45.5 11.36 15.81<br />
19-24 mo 51.32 -0.32 15.76<br />
2-2.5 yrs 51.16 3.61 16.35<br />
2.5-3.5 yrs 53.08 7.41 17.66<br />
3.5-4.5 yrs 57.32 4.97 18.66<br />
4.5-5.5 yrs 60.32<br />
99 th % ile <strong>f<strong>in</strong>ger</strong> tip<br />
length<br />
Method 2 uses the percentage of <strong>f<strong>in</strong>ger</strong> tip to overall <strong>f<strong>in</strong>ger</strong> length <strong>for</strong> each age group <strong>in</strong> the 2.5 years-3.5<br />
years age groups (the only age <strong>for</strong> which all data are available). The same percentage was then<br />
assumed <strong>for</strong> younger children (hence the data <strong>in</strong> brackets <strong>in</strong> Tables 16, 17 and 18). This is based on the<br />
assumption that the proportion of the <strong>f<strong>in</strong>ger</strong> tip to the overall <strong>f<strong>in</strong>ger</strong> length is the same <strong>for</strong> children under<br />
2.5 years as it is <strong>for</strong> children over 2.5 years. These results are shown <strong>in</strong> Table 16 (mean values), Table<br />
17 (1 st percentile) and Table 18 (99 th percentile).<br />
19