Sample NMS Reference Report by YONTCHANG G - University of ...
Sample NMS Reference Report by YONTCHANG G - University of ...
Sample NMS Reference Report by YONTCHANG G - University of ...

You also want an ePaper? Increase the reach of your titles
YUMPU automatically turns print PDFs into web optimized ePapers that Google loves.
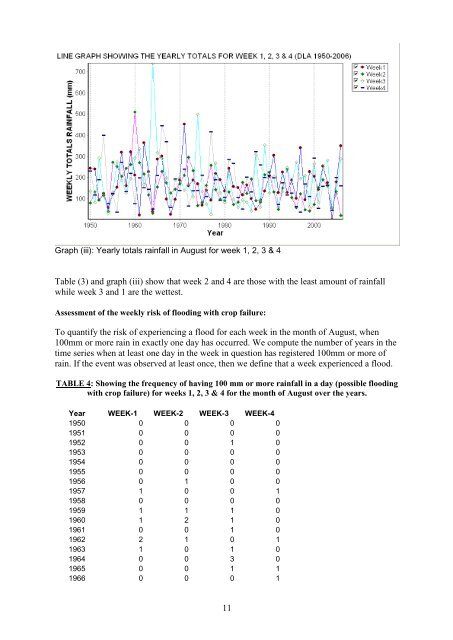
Graph (iii): Yearly totals rainfall in August for week 1, 2, 3 & 4<br />
Table (3) and graph (iii) show that week 2 and 4 are those with the least amount <strong>of</strong> rainfall<br />
while week 3 and 1 are the wettest.<br />
Assessment <strong>of</strong> the weekly risk <strong>of</strong> flooding with crop failure:<br />
To quantify the risk <strong>of</strong> experiencing a flood for each week in the month <strong>of</strong> August, when<br />
100mm or more rain in exactly one day has occurred. We compute the number <strong>of</strong> years in the<br />
time series when at least one day in the week in question has registered 100mm or more <strong>of</strong><br />
rain. If the event was observed at least once, then we define that a week experienced a flood.<br />
TABLE 4: Showing the frequency <strong>of</strong> having 100 mm or more rainfall in a day (possible flooding<br />
with crop failure) for weeks 1, 2, 3 & 4 for the month <strong>of</strong> August over the years.<br />
Year WEEK-1 WEEK-2 WEEK-3 WEEK-4<br />
1950 0 0 0 0<br />
1951 0 0 0 0<br />
1952 0 0 1 0<br />
1953 0 0 0 0<br />
1954 0 0 0 0<br />
1955 0 0 0 0<br />
1956 0 1 0 0<br />
1957 1 0 0 1<br />
1958 0 0 0 0<br />
1959 1 1 1 0<br />
1960 1 2 1 0<br />
1961 0 0 1 0<br />
1962 2 1 0 1<br />
1963 1 0 1 0<br />
1964 0 0 3 0<br />
1965 0 0 1 1<br />
1966 0 0 0 1<br />
11