7. Interference of Sound Waves
7. Interference of Sound Waves
7. Interference of Sound Waves

You also want an ePaper? Increase the reach of your titles
YUMPU automatically turns print PDFs into web optimized ePapers that Google loves.
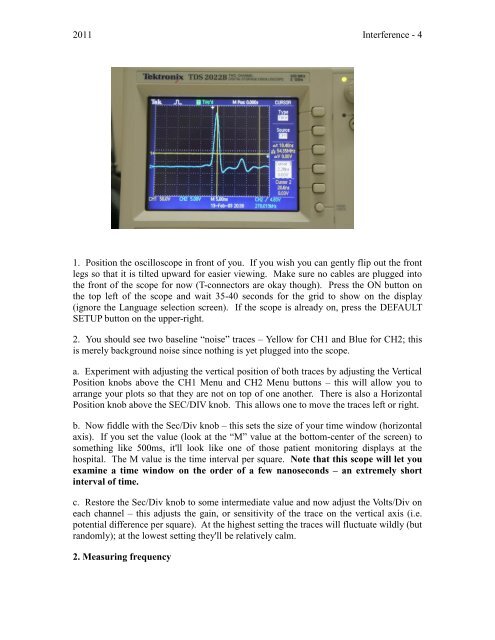
2011 <strong>Interference</strong> - 4<br />
1. Position the oscilloscope in front <strong>of</strong> you. If you wish you can gently flip out the front<br />
legs so that it is tilted upward for easier viewing. Make sure no cables are plugged into<br />
the front <strong>of</strong> the scope for now (T-connectors are okay though). Press the ON button on<br />
the top left <strong>of</strong> the scope and wait 35-40 seconds for the grid to show on the display<br />
(ignore the Language selection screen). If the scope is already on, press the DEFAULT<br />
SETUP button on the upper-right.<br />
2. You should see two baseline “noise” traces – Yellow for CH1 and Blue for CH2; this<br />
is merely background noise since nothing is yet plugged into the scope.<br />
a. Experiment with adjusting the vertical position <strong>of</strong> both traces by adjusting the Vertical<br />
Position knobs above the CH1 Menu and CH2 Menu buttons – this will allow you to<br />
arrange your plots so that they are not on top <strong>of</strong> one another. There is also a Horizontal<br />
Position knob above the SEC/DIV knob. This allows one to move the traces left or right.<br />
b. Now fiddle with the Sec/Div knob – this sets the size <strong>of</strong> your time window (horizontal<br />
axis). If you set the value (look at the “M” value at the bottom-center <strong>of</strong> the screen) to<br />
something like 500ms, it'll look like one <strong>of</strong> those patient monitoring displays at the<br />
hospital. The M value is the time interval per square. Note that this scope will let you<br />
examine a time window on the order <strong>of</strong> a few nanoseconds – an extremely short<br />
interval <strong>of</strong> time.<br />
c. Restore the Sec/Div knob to some intermediate value and now adjust the Volts/Div on<br />
each channel – this adjusts the gain, or sensitivity <strong>of</strong> the trace on the vertical axis (i.e.<br />
potential difference per square). At the highest setting the traces will fluctuate wildly (but<br />
randomly); at the lowest setting they'll be relatively calm.<br />
2. Measuring frequency


![More Effective C++ [Meyers96]](https://img.yumpu.com/25323611/1/184x260/more-effective-c-meyers96.jpg?quality=85)