Master Thesis Effect of vortex shaking on the ... - Physik-Institut
Master Thesis Effect of vortex shaking on the ... - Physik-Institut
Master Thesis Effect of vortex shaking on the ... - Physik-Institut

You also want an ePaper? Increase the reach of your titles
YUMPU automatically turns print PDFs into web optimized ePapers that Google loves.
<str<strong>on</strong>g>Master</str<strong>on</strong>g> <str<strong>on</strong>g>Thesis</str<strong>on</strong>g><br />
<str<strong>on</strong>g>Effect</str<strong>on</strong>g> <str<strong>on</strong>g>of</str<strong>on</strong>g> <str<strong>on</strong>g>vortex</str<strong>on</strong>g> <str<strong>on</strong>g>shaking</str<strong>on</strong>g> <strong>on</strong> <strong>the</strong> resistivity <str<strong>on</strong>g>of</str<strong>on</strong>g><br />
type-II superc<strong>on</strong>ductors<br />
By<br />
Stefan J. Menzi<br />
Physics <strong>Institut</strong>e<br />
<str<strong>on</strong>g>of</str<strong>on</strong>g> <strong>the</strong><br />
University <str<strong>on</strong>g>of</str<strong>on</strong>g> Zurich<br />
Supervised by<br />
Pr<str<strong>on</strong>g>of</str<strong>on</strong>g>. A. Schilling<br />
August 29, 2007
C<strong>on</strong>tents<br />
1 Introducti<strong>on</strong> 1<br />
2 The Theory 2<br />
2.1 Superc<strong>on</strong>ductivity . . . . . . . . . . . . . . . . . . . . . . . . . 2<br />
2.1.1 High-Temperature Superc<strong>on</strong>ductors . . . . . . . . . . . 2<br />
2.1.2 The melting transiti<strong>on</strong> . . . . . . . . . . . . . . . . . . 5<br />
2.2 Vortex <str<strong>on</strong>g>shaking</str<strong>on</strong>g> . . . . . . . . . . . . . . . . . . . . . . . . . . 6<br />
2.3 Sample . . . . . . . . . . . . . . . . . . . . . . . . . . . . . . . 7<br />
3 The Experiment 11<br />
3.1 Design . . . . . . . . . . . . . . . . . . . . . . . . . . . . . . . 11<br />
3.2 Electrical c<strong>on</strong>tacts . . . . . . . . . . . . . . . . . . . . . . . . 12<br />
3.3 Testphase . . . . . . . . . . . . . . . . . . . . . . . . . . . . . 12<br />
3.4 Measurements . . . . . . . . . . . . . . . . . . . . . . . . . . . 14<br />
3.5 A New Material... . . . . . . . . . . . . . . . . . . . . . . . . . 19<br />
3.6 ...and a new <str<strong>on</strong>g>shaking</str<strong>on</strong>g> technique . . . . . . . . . . . . . . . . . . 20<br />
4 Interpretati<strong>on</strong> and C<strong>on</strong>clusi<strong>on</strong> 27<br />
4.1 NdBa 2 Cu 3 O 7−d . . . . . . . . . . . . . . . . . . . . . . . . . . 27<br />
4.2 LuNi 2 B 2 C . . . . . . . . . . . . . . . . . . . . . . . . . . . . . 28<br />
5 Appendix 29<br />
i
1 Introducti<strong>on</strong><br />
The decisi<strong>on</strong> to write a master <strong>the</strong>sis about superc<strong>on</strong>ductivity was founded <strong>on</strong><br />
two different motivati<strong>on</strong>s. The first was my general interest in this amazing<br />
phenomen<strong>on</strong>, which is as well <strong>the</strong>oretically as practically <str<strong>on</strong>g>of</str<strong>on</strong>g> great importance<br />
and very promising for <strong>the</strong> future. My sec<strong>on</strong>d motivati<strong>on</strong> was that it gave<br />
me <strong>the</strong> possibility to c<strong>on</strong>duct a whole experiment from its planning to its<br />
c<strong>on</strong>clusi<strong>on</strong>, step by step, and <str<strong>on</strong>g>of</str<strong>on</strong>g>fered a diverse range <str<strong>on</strong>g>of</str<strong>on</strong>g> work, from <strong>the</strong> designing<br />
<str<strong>on</strong>g>of</str<strong>on</strong>g> <strong>the</strong> setup to <strong>the</strong> assembling <str<strong>on</strong>g>of</str<strong>on</strong>g> <strong>the</strong> experiment and in <strong>the</strong> end to<br />
its interpretati<strong>on</strong>.<br />
The main goal <str<strong>on</strong>g>of</str<strong>on</strong>g> this master <strong>the</strong>sis was to find out if <strong>the</strong> characteristics <str<strong>on</strong>g>of</str<strong>on</strong>g><br />
<strong>the</strong> resistivity at <strong>the</strong> liquid-to-solid phase transiti<strong>on</strong> <str<strong>on</strong>g>of</str<strong>on</strong>g> a clean single crystal<br />
in a magnetic field can also be seen in a slightly disordered crystal, which is<br />
addressed by using a process called <str<strong>on</strong>g>vortex</str<strong>on</strong>g> <str<strong>on</strong>g>shaking</str<strong>on</strong>g>, <strong>the</strong> applicati<strong>on</strong> <str<strong>on</strong>g>of</str<strong>on</strong>g> an ac<br />
magnetic field perpendicular to <strong>the</strong> main field to <strong>the</strong> crystal, which should<br />
“shake” vortices trapped in pinning centers into <strong>the</strong>ir equilibrium state. Vortex<br />
<str<strong>on</strong>g>shaking</str<strong>on</strong>g> is a relatively new technique, <strong>the</strong>reby opening a lot <str<strong>on</strong>g>of</str<strong>on</strong>g> new possibilities<br />
for interesting discoveries.<br />
This work was c<strong>on</strong>ducted under <strong>the</strong> supervisi<strong>on</strong> <str<strong>on</strong>g>of</str<strong>on</strong>g> Pr<str<strong>on</strong>g>of</str<strong>on</strong>g>. Dr. Andreas<br />
Schilling and with <strong>the</strong> help <str<strong>on</strong>g>of</str<strong>on</strong>g> his research group at <strong>the</strong> University <str<strong>on</strong>g>of</str<strong>on</strong>g> Zurich.<br />
1
2 The Theory<br />
2.1 Superc<strong>on</strong>ductivity<br />
Superc<strong>on</strong>ductivity is today, as it has been for many years now, a very active<br />
field in modern solid-state physics research and although that many scientists<br />
are dedicated to it, <strong>the</strong>re are still a lot <str<strong>on</strong>g>of</str<strong>on</strong>g> unanswered questi<strong>on</strong>s. Areas like<br />
Low T c Superc<strong>on</strong>ductivity (LTS) are now thought to be fully understood, but<br />
especially High T c Superc<strong>on</strong>ductivity (HTS) is still full <str<strong>on</strong>g>of</str<strong>on</strong>g> open questi<strong>on</strong>s, as<br />
<strong>the</strong> Bardeen-Cooper-Schriefer-Theory (BCS)[1], which works so fine for LTS<br />
does not hold anymore for HTS. But as many experiments during <strong>the</strong> last<br />
decades have shown, <strong>the</strong> supercurrent in high-temperature superc<strong>on</strong>ductors<br />
is still carried by <strong>the</strong>se pairs <str<strong>on</strong>g>of</str<strong>on</strong>g> correlated electr<strong>on</strong>s. It is now <strong>the</strong> goal <str<strong>on</strong>g>of</str<strong>on</strong>g><br />
superc<strong>on</strong>ductivity research to find a c<strong>on</strong>sistent <strong>the</strong>ory to explain this str<strong>on</strong>g<br />
mechanism that keeps <strong>the</strong> Cooper pairs toge<strong>the</strong>r, and hence to explain how<br />
HTS really works. This understanding could lead to an even fur<strong>the</strong>r raise<br />
<str<strong>on</strong>g>of</str<strong>on</strong>g> <strong>the</strong> transiti<strong>on</strong> temperatures for <strong>the</strong> <strong>on</strong>set <str<strong>on</strong>g>of</str<strong>on</strong>g> superc<strong>on</strong>ductivity like some<br />
authors, e. g. Ashcr<str<strong>on</strong>g>of</str<strong>on</strong>g>t[2], believe even up to room temperature. The work<br />
that we have been doing should help to ga<strong>the</strong>r some more insights, so that<br />
eventually all <strong>the</strong> pieces <str<strong>on</strong>g>of</str<strong>on</strong>g> <strong>the</strong> puzzle can be put toge<strong>the</strong>r and reveal <strong>the</strong><br />
whole picture <str<strong>on</strong>g>of</str<strong>on</strong>g> high-temperature superc<strong>on</strong>ductivity.<br />
As I already treated <strong>the</strong> phenomen<strong>on</strong> <str<strong>on</strong>g>of</str<strong>on</strong>g> superc<strong>on</strong>ductivity in general in my<br />
Bachelor <str<strong>on</strong>g>Thesis</str<strong>on</strong>g>, I will not discuss <strong>the</strong> general topic here fur<strong>the</strong>r. For more informati<strong>on</strong><br />
about superc<strong>on</strong>ductivity I refer to literature such as “Supraleitung”<br />
<str<strong>on</strong>g>of</str<strong>on</strong>g> W. Buckel[4] and my Bachelor <str<strong>on</strong>g>Thesis</str<strong>on</strong>g>[5].<br />
2.1.1 High-Temperature Superc<strong>on</strong>ductors<br />
The first high-temperature superc<strong>on</strong>ductor was found by Karl A. Müller and<br />
Johannes Bednorz in 1986[6], a discovery which was immediately recognized<br />
by <strong>the</strong> Nobel Prize in Physics in 1987. The LaBaCuO compound <strong>the</strong>y studied<br />
had a critical temperature <str<strong>on</strong>g>of</str<strong>on</strong>g> 30K, which was very much unexpected, as this<br />
cuprate-perovskite material was a ceramic and as such almost an insulator at<br />
room temperature. Later <strong>on</strong> more and more cuprates with even higher critical<br />
temperatures were discovered, really earning <strong>the</strong>ir name as so<strong>on</strong> as <strong>the</strong>y<br />
crossed <strong>the</strong> critical temperature <str<strong>on</strong>g>of</str<strong>on</strong>g> liquid nitrogen at 77K, making it far easier<br />
and especially cheaper to handle superc<strong>on</strong>ductors. All high-temperature<br />
superc<strong>on</strong>ductors are type-II superc<strong>on</strong>ductors, which means that <strong>the</strong>y <strong>on</strong>ly<br />
show a partial Meissner effect above a certain lower critical magnetic field<br />
B c1 . Bey<strong>on</strong>d B c1 , in <strong>the</strong> so-called mixed state, <strong>the</strong> magnetic field penetrates<br />
<strong>the</strong> material in flux lines (vortices), which form a so-called Abrikosov lattice<br />
2
for lower temperatures and a <str<strong>on</strong>g>vortex</str<strong>on</strong>g> glass or fluid for higher temperatures<br />
without destroying <strong>the</strong> cooper pairs. The circular currents forming <strong>the</strong> flux<br />
lines c<strong>on</strong>fine <strong>the</strong> magnetic field lines and mark a border between normal and<br />
superc<strong>on</strong>ducting regi<strong>on</strong>s.<br />
Figure 1: Shubnikov-Phase (“mixed state”) in a Type II superc<strong>on</strong>ductor with<br />
<strong>the</strong> Abrikosov lattice.<br />
The mixed state, in which magnetic flux flows through <strong>the</strong> material, is<br />
called <strong>the</strong> Shubnikov 1 phase. Under <strong>the</strong> right c<strong>on</strong>diti<strong>on</strong>s (low temperatures,<br />
small currents and a field strength below B m (T), <strong>the</strong> melting line), <strong>the</strong> vortices<br />
form a rigid lattice, called Abrikosov 2 lattice, named after Abrikosov<br />
who first predicted it[7]. If a current is flowing through <strong>the</strong> superc<strong>on</strong>ductor<br />
in this mixed state, it produces a Lorentz force acting <strong>on</strong> <strong>the</strong> vortices. In an<br />
ideal superc<strong>on</strong>ductor without any defects this force would generate a moti<strong>on</strong><br />
<str<strong>on</strong>g>of</str<strong>on</strong>g> <strong>the</strong> vortices, hence a moti<strong>on</strong> <str<strong>on</strong>g>of</str<strong>on</strong>g> <strong>the</strong> lattice. Real superc<strong>on</strong>ductors however<br />
have all some sorts <str<strong>on</strong>g>of</str<strong>on</strong>g> defects or impurities, like grain boundaries, dislocati<strong>on</strong><br />
walls, voids, etc., where <strong>the</strong> magnetic flux gets trapped and which act as<br />
“pinning centers” for <strong>the</strong> vortices, keeping <strong>the</strong>m and with <strong>the</strong>m <strong>the</strong> whole<br />
1 Lev Vasilyevich Shubnikov, 1901 - 1937, Russian physicist and experimenter<br />
2 Alexei Alexeyevich Abrikosov, born 1928 in Moscow, co-recipient <str<strong>on</strong>g>of</str<strong>on</strong>g> <strong>the</strong> 2003 Nobel<br />
Prize in Physics<br />
3
lattice in place. But as so<strong>on</strong> as any <str<strong>on</strong>g>of</str<strong>on</strong>g> <strong>the</strong> afore menti<strong>on</strong>ed c<strong>on</strong>diti<strong>on</strong>s rise<br />
above certain, material dependent values, <strong>the</strong> <str<strong>on</strong>g>vortex</str<strong>on</strong>g> lattice begins to move<br />
or even melt. The individual vortices start to move, first just a wobbling at<br />
<strong>the</strong>ir place, <strong>the</strong>n through <strong>the</strong> material, when <strong>the</strong> pinning forces and <strong>the</strong> lattice<br />
are no l<strong>on</strong>ger str<strong>on</strong>g enough to hold <strong>the</strong>m against <strong>the</strong> Lorentz force. The<br />
movement is perpendicular to <strong>the</strong> current and <strong>the</strong> field[8]. This possibility<br />
for <strong>the</strong> <str<strong>on</strong>g>vortex</str<strong>on</strong>g> lattice to melt at sufficiently high temperatures, makes <strong>the</strong><br />
phase diagram and <strong>the</strong> behavior <str<strong>on</strong>g>of</str<strong>on</strong>g> a HTS significantly different from o<strong>the</strong>r<br />
low T c type-II superc<strong>on</strong>ductors, see figure 2 and [11], as <strong>the</strong> melting transiti<strong>on</strong><br />
marks <strong>the</strong> <strong>on</strong>set <str<strong>on</strong>g>of</str<strong>on</strong>g> a finite resistivity well inside <strong>the</strong> superc<strong>on</strong>ducting<br />
regime, see figures 20 and 21 in <strong>the</strong> appendix.<br />
Figure 2: Phase diagrams <str<strong>on</strong>g>of</str<strong>on</strong>g> a c<strong>on</strong>venti<strong>on</strong>al low temperature and a high T c<br />
type-II superc<strong>on</strong>ductor.<br />
4
2.1.2 The melting transiti<strong>on</strong><br />
Let us have a closer look at <strong>the</strong> melting <str<strong>on</strong>g>of</str<strong>on</strong>g> <strong>the</strong> <str<strong>on</strong>g>vortex</str<strong>on</strong>g> lattice. In order to do<br />
this, we must first ga<strong>the</strong>r some more insights into <strong>the</strong> main characteristics<br />
<str<strong>on</strong>g>of</str<strong>on</strong>g> high-temperature superc<strong>on</strong>ductors. All <strong>the</strong> HTS’s are based <strong>on</strong> copper<br />
oxides, compounds made out <str<strong>on</strong>g>of</str<strong>on</strong>g> electrically c<strong>on</strong>ducting CuO 2 layers and insulating<br />
layers <str<strong>on</strong>g>of</str<strong>on</strong>g> o<strong>the</strong>r oxides. This layered structure leads to an extreme<br />
anisotropy with an anisotropy parameter γ ≫ 1. The anisotropy parameter<br />
γ stands for <strong>the</strong> relati<strong>on</strong> between perpendicular and parallel magnetic<br />
penetrati<strong>on</strong> depth. Ano<strong>the</strong>r extreme property <str<strong>on</strong>g>of</str<strong>on</strong>g> high-temperature superc<strong>on</strong>ductors<br />
is <strong>the</strong> dimensi<strong>on</strong>less Ginzburg-Landau parameter κ = λ/ξ, <strong>the</strong><br />
relati<strong>on</strong> between <strong>the</strong> magnetic penetrati<strong>on</strong> depth λ and <strong>the</strong> coherence length<br />
ξ, <strong>the</strong> minimal length for a change in <strong>the</strong> superc<strong>on</strong>ducting order parameter<br />
Ψ. In a HTS type-II superc<strong>on</strong>ductor, λ is unusually large, whereas ξ is extremely<br />
small, resulting in a κ ≫ 1. E. g. BSCCO (Bi2223) has a κ <str<strong>on</strong>g>of</str<strong>on</strong>g> over<br />
130, lead <strong>on</strong> <strong>the</strong> o<strong>the</strong>r hand, a low-temperature superc<strong>on</strong>ductor with a T c <str<strong>on</strong>g>of</str<strong>on</strong>g><br />
7.2K, has a κ <str<strong>on</strong>g>of</str<strong>on</strong>g> 0.47. (This gives <strong>on</strong>e <str<strong>on</strong>g>of</str<strong>on</strong>g> <strong>the</strong> criteria for <strong>the</strong> definiti<strong>on</strong> <str<strong>on</strong>g>of</str<strong>on</strong>g> <strong>the</strong><br />
difference between type-I and type-II superc<strong>on</strong>ductors, given by Abrikosov:<br />
If κ is smaller than 1/ √ 2 ≃ 0.71 <strong>the</strong> superc<strong>on</strong>ductor is <str<strong>on</strong>g>of</str<strong>on</strong>g> type-I, if it is<br />
bigger than 1/ √ 2 <strong>the</strong>n it is a type-II.) Now, <strong>the</strong> elastic properties <str<strong>on</strong>g>of</str<strong>on</strong>g> <strong>the</strong><br />
<str<strong>on</strong>g>vortex</str<strong>on</strong>g> lattice depend heavily <strong>on</strong> <strong>the</strong>se parameters. The smaller ξ and <strong>the</strong><br />
larger λ is, <strong>the</strong> s<str<strong>on</strong>g>of</str<strong>on</strong>g>ter are <strong>the</strong> vortices and <strong>the</strong> weaker <strong>the</strong> stabilizing forces <strong>on</strong><br />
<strong>the</strong>m, meaning that <strong>the</strong>y are easier to move out <str<strong>on</strong>g>of</str<strong>on</strong>g> <strong>the</strong>ir lattice positi<strong>on</strong>s. For<br />
an anisotropic superc<strong>on</strong>ductor <strong>the</strong>se movements are even a factor γ str<strong>on</strong>ger<br />
than for an isotropic <strong>on</strong>e. All <strong>the</strong>se factors lead to very “bendable” vortices<br />
under marginal mechanical stress, which are, because <str<strong>on</strong>g>of</str<strong>on</strong>g> <strong>the</strong> relatively<br />
high temperatures, subject to str<strong>on</strong>g <strong>the</strong>rmal fluctuati<strong>on</strong>s. For low enough<br />
temperatures, <strong>the</strong> vortices are bound to natural pinning centers and form a<br />
regular Abrikosov lattice, but as so<strong>on</strong> as <strong>the</strong> temperature reaches a certain<br />
value T m , which might be far below T c in str<strong>on</strong>g magnetic fields, <strong>the</strong> <strong>the</strong>rmal<br />
fluctuati<strong>on</strong>s get str<strong>on</strong>g enough to rip <strong>the</strong> vortices out <str<strong>on</strong>g>of</str<strong>on</strong>g> <strong>the</strong>ir positi<strong>on</strong>s. This<br />
results in <strong>the</strong> melting <str<strong>on</strong>g>of</str<strong>on</strong>g> <strong>the</strong> lattice, just like ice melts. The melting follows<br />
approximately <strong>the</strong> so-called Lindemann-criteri<strong>on</strong>, which states that <strong>the</strong><br />
melting occurs when <strong>the</strong> <strong>the</strong>rmal fluctuati<strong>on</strong>s <str<strong>on</strong>g>of</str<strong>on</strong>g> <strong>the</strong> vortices reach a certain<br />
fracti<strong>on</strong> (5 to 20%) <str<strong>on</strong>g>of</str<strong>on</strong>g> <strong>the</strong> mean distance between vortices in <strong>the</strong> lattice, see<br />
[9],[10]. Once <strong>the</strong> melting took place, <strong>the</strong> vortices are able to move freely<br />
through <strong>the</strong> material, unbound from any pinning centers. In this phase,<br />
vortices can be seen as interacting, particle like objects, resembling cooked<br />
spaghetti[11]. If a current is applied to <strong>the</strong> superc<strong>on</strong>ductor <strong>the</strong> moti<strong>on</strong> <str<strong>on</strong>g>of</str<strong>on</strong>g> <strong>the</strong><br />
vortices due to <strong>the</strong> Lorentz force leads to <strong>the</strong> development <str<strong>on</strong>g>of</str<strong>on</strong>g> a l<strong>on</strong>gitudinal<br />
potential gradient in <strong>the</strong> superc<strong>on</strong>ductor, which accounts for an energy loss in<br />
5
<strong>the</strong> fluid, observed as a finite resistance in <strong>the</strong> still superc<strong>on</strong>ducting regime.<br />
This energy loss happens due to several mechanisms: The most important<br />
<strong>on</strong>e is <strong>the</strong> moti<strong>on</strong> <str<strong>on</strong>g>of</str<strong>on</strong>g> <strong>the</strong> normal-c<strong>on</strong>ducting core inside <strong>the</strong> vortices through<br />
<strong>the</strong> material, where its electr<strong>on</strong>s are scattered <strong>on</strong> <strong>the</strong> <strong>the</strong>rmal lattice vibrati<strong>on</strong>s,<br />
resulting in Joule losses. Ano<strong>the</strong>r source <str<strong>on</strong>g>of</str<strong>on</strong>g> energy loss is <strong>the</strong> so-called<br />
<strong>the</strong>rmal mechanism <str<strong>on</strong>g>of</str<strong>on</strong>g> dissipati<strong>on</strong>. Vortex moti<strong>on</strong> is always accompanied by<br />
energy absorpti<strong>on</strong> in <strong>the</strong> regi<strong>on</strong> <str<strong>on</strong>g>of</str<strong>on</strong>g> <strong>the</strong> forward boundary <str<strong>on</strong>g>of</str<strong>on</strong>g> <strong>the</strong> vortices where<br />
<strong>the</strong> superc<strong>on</strong>ducting phase changes into <strong>the</strong> normal phase. This leads to <strong>the</strong><br />
appearance <str<strong>on</strong>g>of</str<strong>on</strong>g> microscopic <strong>the</strong>rmal gradients accompanied by heat flow and<br />
energy dissipati<strong>on</strong>[17]. Fur<strong>the</strong>rmore <strong>the</strong> vortices loose energy <strong>on</strong> encountering<br />
pinning centers, etc. This is why it can happen that <strong>the</strong> resistance <str<strong>on</strong>g>of</str<strong>on</strong>g><br />
a high-temperature superc<strong>on</strong>ductor doesn’t immediately drop to zero when<br />
T c is reached. It ra<strong>the</strong>r stays finite, although falling significantly faster than<br />
before T c , until <strong>the</strong> melting line is reached. There <strong>the</strong> vortices stop moving<br />
and settle in <strong>the</strong>ir lattice positi<strong>on</strong> and <strong>the</strong> resistivity finally drops to zero,<br />
but <strong>on</strong>ly if <strong>the</strong> material is very clean and has very few pinning centers. O<strong>the</strong>rwise<br />
<strong>the</strong> ever less mobile vortices get trapped in a pinning center and <strong>the</strong><br />
equilibrium lattice can’t properly form and critical currents keep circulating<br />
in <strong>the</strong> material. This leads again to a delay <str<strong>on</strong>g>of</str<strong>on</strong>g> <strong>the</strong> <strong>on</strong>set <str<strong>on</strong>g>of</str<strong>on</strong>g> zero resistivity,<br />
which holds <strong>on</strong> for a few Kelvin until <strong>the</strong> binding forces <str<strong>on</strong>g>of</str<strong>on</strong>g> <strong>the</strong> lattice get<br />
str<strong>on</strong>g enough to bring <strong>the</strong> trapped vortices into equilibrium.<br />
2.2 Vortex <str<strong>on</strong>g>shaking</str<strong>on</strong>g><br />
Since <strong>the</strong> early 1970s it is known that a small oscillating ac magnetic field<br />
applied perpendicular to <strong>the</strong> main field B influences <strong>the</strong> depinning current<br />
density and can str<strong>on</strong>gly modify <strong>the</strong> transport properties <str<strong>on</strong>g>of</str<strong>on</strong>g> type-II superc<strong>on</strong>ductors<br />
in <strong>the</strong> flux-flow state [12]. Later in <strong>the</strong> 1990s it was observed<br />
by Willemin et al.[13], that <strong>the</strong> applicati<strong>on</strong> <str<strong>on</strong>g>of</str<strong>on</strong>g> such an ac field leads to a<br />
fast depinning <str<strong>on</strong>g>of</str<strong>on</strong>g> <strong>the</strong> <str<strong>on</strong>g>vortex</str<strong>on</strong>g> lattice and hence to significant growth <str<strong>on</strong>g>of</str<strong>on</strong>g> <strong>the</strong><br />
reversible domain in <strong>the</strong> magnetic field (H) versus Temperature (T) plane <str<strong>on</strong>g>of</str<strong>on</strong>g><br />
a high-temperature superc<strong>on</strong>ductor. The <strong>the</strong>oretical basis for this effect was<br />
established by E. H. Brandt et al. in [14] and was later <strong>on</strong> advanced by G.<br />
Mikitik and Brandt in a series <str<strong>on</strong>g>of</str<strong>on</strong>g> papers, see [15] and citati<strong>on</strong>s <strong>the</strong>rein. Vortex<br />
<str<strong>on</strong>g>shaking</str<strong>on</strong>g> is, generally speaking, a process to literally shake vortices out <str<strong>on</strong>g>of</str<strong>on</strong>g><br />
<strong>the</strong>ir pinning centers into <strong>the</strong>ir equilibrium state. This leads to a relaxati<strong>on</strong><br />
<str<strong>on</strong>g>of</str<strong>on</strong>g> <strong>the</strong> <str<strong>on</strong>g>vortex</str<strong>on</strong>g> lattice and <strong>the</strong>rewith to <strong>the</strong> menti<strong>on</strong>ed growth <str<strong>on</strong>g>of</str<strong>on</strong>g> <strong>the</strong> reversible<br />
domain in <strong>the</strong> (H,T) phase diagram <str<strong>on</strong>g>of</str<strong>on</strong>g> a high-temperature superc<strong>on</strong>ductor,<br />
which is needed e. g. to study various typical parameters within <strong>the</strong> so-called<br />
L<strong>on</strong>d<strong>on</strong> model, which needs a <strong>the</strong>rmodynamic equilibrium <str<strong>on</strong>g>of</str<strong>on</strong>g> <strong>the</strong> mixed state<br />
[13], [18]. In this experiment we try to apply this technique to see directly<br />
6
<strong>on</strong> <strong>on</strong>e single crystal <strong>the</strong> difference in resistivity between a melting transiti<strong>on</strong><br />
where vortices are held in pinning centers and <strong>on</strong>e where <strong>the</strong>y are in equilibrium.<br />
The technique works as follows: C<strong>on</strong>sider a thin superc<strong>on</strong>ducting strip that<br />
fills <strong>the</strong> space |x| ≤ w, |y| < ∞, |z| ≤ d/2 with d ≪ w, and a c<strong>on</strong>stant homogeneous<br />
external magnetic field H a which is directed al<strong>on</strong>g z, while an ac<br />
magnetic field h ac = h cosωt is applied al<strong>on</strong>g x, perpendicular to H a and to<br />
<strong>the</strong> shielding currents in <strong>the</strong> sample. We make <strong>the</strong> Bean assumpti<strong>on</strong> that<br />
<strong>the</strong> critical current density j c does not depend <strong>on</strong> <strong>the</strong> local inducti<strong>on</strong> B [19].<br />
The currents flowing in <strong>the</strong> critical state <str<strong>on</strong>g>of</str<strong>on</strong>g> <strong>the</strong> strip generate a n<strong>on</strong>uniform<br />
distributi<strong>on</strong> <str<strong>on</strong>g>of</str<strong>on</strong>g> <strong>the</strong> magnetic inducti<strong>on</strong> B z (x), as <strong>the</strong> self-field <str<strong>on</strong>g>of</str<strong>on</strong>g> <strong>the</strong> currents<br />
adds to h ac <strong>on</strong> <strong>the</strong> upper (or lower) plane <str<strong>on</strong>g>of</str<strong>on</strong>g> <strong>the</strong> strip and reduces it <strong>on</strong> <strong>the</strong><br />
opposite plane. As a result, <strong>the</strong> applied ac field periodically tilts <strong>the</strong> vortices<br />
in this state. However, at each point x with a n<strong>on</strong>zero sheet current J(x)<br />
(<strong>the</strong> current density integrated over <strong>the</strong> thickness d), <strong>the</strong> tilt is not symmetric<br />
relative to <strong>the</strong> central plane <str<strong>on</strong>g>of</str<strong>on</strong>g> <strong>the</strong> strip z = 0, and during each cycle <str<strong>on</strong>g>of</str<strong>on</strong>g> <strong>the</strong><br />
ac field, <strong>the</strong> asymmetry leads to a drift <str<strong>on</strong>g>of</str<strong>on</strong>g> vortices towards <strong>the</strong> center x = 0<br />
<str<strong>on</strong>g>of</str<strong>on</strong>g> <strong>the</strong> strip. This shift tends to equilibrate B z (x), and it also generates a dc<br />
electric field which decreases J(x). When J(x) reaches zero, <strong>the</strong> asymmetry<br />
disappears, and <strong>the</strong> process stops[16].<br />
Unfortunately, <strong>the</strong> above treatment is <strong>on</strong>ly valid for currents flowing perpendicular<br />
to <strong>the</strong> ac field. As it is very unlikely to have an almost infinitely<br />
l<strong>on</strong>g and thin superc<strong>on</strong>ducting sample for <strong>the</strong> experiments, it is necessary to<br />
treat l<strong>on</strong>gitudinal <str<strong>on</strong>g>shaking</str<strong>on</strong>g>, with currents flowing parallel to <strong>the</strong> ac field as<br />
well. This is somewhat more complicated. We have now again <strong>the</strong> same setting<br />
as above, but this time h ac is parallel to <strong>the</strong> sheet current J which flows<br />
in y directi<strong>on</strong>. The vortices are again tilted by <strong>the</strong> ac field, this time from<br />
z towards <strong>the</strong> y directi<strong>on</strong>. This happens because <strong>the</strong> critical-current density<br />
j c (z) = [j cx (z), j cy (z), 0] has a n<strong>on</strong>zero x comp<strong>on</strong>ent which is antisymmetric<br />
in z, j cx (z) = −j cx (−z). Thus, j c (z) = j c (z)[−sinφ(z), cosφ(z), 0] flows at an<br />
angle φ(z) to <strong>the</strong> y axis. Since <strong>the</strong> Lorentz force applied to an infinitesimal<br />
element <str<strong>on</strong>g>of</str<strong>on</strong>g> <strong>the</strong> <str<strong>on</strong>g>vortex</str<strong>on</strong>g> is normal to j c (z), and <strong>the</strong> element drifts al<strong>on</strong>g this<br />
force, <strong>the</strong> tilt al<strong>on</strong>g y is always accompanied by a small drift al<strong>on</strong>g x. This<br />
drift is independent <str<strong>on</strong>g>of</str<strong>on</strong>g> <strong>the</strong> sign <str<strong>on</strong>g>of</str<strong>on</strong>g> h ac , and hence, under <strong>the</strong> influence <str<strong>on</strong>g>of</str<strong>on</strong>g> an<br />
ac field, <strong>the</strong> <str<strong>on</strong>g>vortex</str<strong>on</strong>g> will drift in <strong>the</strong> directi<strong>on</strong> <str<strong>on</strong>g>of</str<strong>on</strong>g> [J y × H z ] by an oscillating<br />
screwlike moti<strong>on</strong>. The mechanisms are fur<strong>the</strong>r explained in Figures 3 and 4.<br />
2.3 Sample<br />
The sample used for this first experiments was a NdBa 2 Cu 3 O 7−d crystal,<br />
optimally doped and twinned. Its critical temperature was ≈ 96.7 K. Nd-<br />
7
Figure 3: Visualizati<strong>on</strong> <str<strong>on</strong>g>of</str<strong>on</strong>g> <strong>the</strong> transverse and l<strong>on</strong>gitudinal <str<strong>on</strong>g>vortex</str<strong>on</strong>g> <str<strong>on</strong>g>shaking</str<strong>on</strong>g>. In<br />
both geometries <strong>the</strong> vortices drift towards <strong>the</strong> center <str<strong>on</strong>g>of</str<strong>on</strong>g> <strong>the</strong> strip. Shown is<br />
<strong>on</strong>e <str<strong>on</strong>g>vortex</str<strong>on</strong>g> at subsequent times tω/π = 0, 1, 2, . . . . Top: If h ac is transverse<br />
to J, <strong>the</strong> vortices “walk” in <strong>the</strong> xz plane (<strong>the</strong> vortices are straight since here<br />
J c ≪ h ac , H a is assumed). Bottom: If h ac is parallel to J, <strong>the</strong> vortices<br />
periodically tilt in <strong>the</strong> yz plane and at <strong>the</strong> same time move al<strong>on</strong>g x. From<br />
[15].<br />
BaCuO has basically <strong>the</strong> same structure as YBCO and is <strong>the</strong>refore a layered<br />
and anisotropic, thus typical, representative <str<strong>on</strong>g>of</str<strong>on</strong>g> <strong>the</strong> famous copper oxides<br />
(see figure 5). The temperatures at which <strong>the</strong> melting transiti<strong>on</strong> occurs are<br />
8
Figure 4: Scheme <str<strong>on</strong>g>of</str<strong>on</strong>g> <strong>the</strong> <str<strong>on</strong>g>vortex</str<strong>on</strong>g> shift in a slab when <strong>the</strong> l<strong>on</strong>gitudinal ac<br />
magnetic field is increased from h ac to h ac + δh. Shown is <strong>the</strong> projecti<strong>on</strong> <strong>on</strong><br />
<strong>the</strong> xy plane <str<strong>on</strong>g>of</str<strong>on</strong>g> a <str<strong>on</strong>g>vortex</str<strong>on</strong>g> (bold solid line) which tilts more away from <strong>the</strong> z axis<br />
and at <strong>the</strong> same time shifts from x = x 0 to x = x 0 +δx 0 . The projected shifts<br />
<str<strong>on</strong>g>of</str<strong>on</strong>g> some <str<strong>on</strong>g>vortex</str<strong>on</strong>g> line elements are shown as dashed arrows with comp<strong>on</strong>ents<br />
δx 0 and δy(z), δy(z) = −δy(−z). These arrows are al<strong>on</strong>g <strong>the</strong> Lorentz force,<br />
which is perpendicular to <strong>the</strong> local current density j c (z) (solid arrows) lying<br />
in <strong>the</strong> xy planes at <strong>the</strong> angle φ(z) to <strong>the</strong> y axis. From [15].<br />
plotted for different magnetic fields in figure 6.<br />
9
Figure 5: Structure <str<strong>on</strong>g>of</str<strong>on</strong>g> YBCO with <strong>the</strong> CuO 2 planes. In NdBCO <strong>the</strong> Yttrium<br />
atoms are replaced by Neodymium.<br />
7<br />
6<br />
5<br />
H||c K<br />
0.0 96.76<br />
3.0 90.92<br />
5.0 88.11<br />
6.0 86.91<br />
7.0 85.71<br />
7.0 85.65<br />
4<br />
µ 0<br />
H(T)<br />
3<br />
2<br />
1<br />
0<br />
84 86 88 90 92 94 96 98<br />
Temperature in K<br />
Figure 6: Locati<strong>on</strong> <str<strong>on</strong>g>of</str<strong>on</strong>g> <strong>the</strong> melting transiti<strong>on</strong> in <strong>the</strong> magnetic phase diagram.<br />
(Data from specific-heat measurements.)<br />
10
3 The Experiment<br />
3.1 Design<br />
The experimental setup was as follows: As a base plate I used a syn<strong>the</strong>tic<br />
sapphire disk, which was chosen because <str<strong>on</strong>g>of</str<strong>on</strong>g> its good <strong>the</strong>rmal c<strong>on</strong>ductance<br />
and electrical insulati<strong>on</strong>. On top <str<strong>on</strong>g>of</str<strong>on</strong>g> it, <strong>on</strong> <strong>the</strong> right, a copper ’gibbet’ was<br />
attached with GE-Varnish to <strong>the</strong> sapphire to support <strong>the</strong> crystal. On <strong>the</strong><br />
left side, a copper coil for <strong>the</strong> ac field was set <strong>on</strong> an unattached copper plate,<br />
making it possible to move it over <strong>the</strong> crystal and back again. This coil<br />
had an inductance <str<strong>on</strong>g>of</str<strong>on</strong>g> about 0.20 mH, with about 200 windings producing a<br />
magnetic field <str<strong>on</strong>g>of</str<strong>on</strong>g> ∼ 1.8 - 3 Oe/mA. See sketch 7 and sketch 22 in <strong>the</strong> appendix<br />
for fur<strong>the</strong>r details <str<strong>on</strong>g>of</str<strong>on</strong>g> <strong>the</strong> setup.<br />
Unfortunately it took an immense amount <str<strong>on</strong>g>of</str<strong>on</strong>g> time to ga<strong>the</strong>r and prepare <strong>the</strong>se<br />
comp<strong>on</strong>ents due to <strong>the</strong> variety <str<strong>on</strong>g>of</str<strong>on</strong>g> people and instituti<strong>on</strong>s involved and <strong>the</strong><br />
Christmas holiday break, which delayed <strong>the</strong> delivery <str<strong>on</strong>g>of</str<strong>on</strong>g> <strong>the</strong> sapphire platelets<br />
for almost a m<strong>on</strong>th.<br />
Originally a four-wire resistivity measurement was planed, but due to <strong>the</strong><br />
problems menti<strong>on</strong>ed in 3.3, <strong>on</strong>ly two-wire measurements could be made.<br />
The system used to measure <strong>the</strong> resistivity and to drive <strong>the</strong> coil was <strong>the</strong><br />
6<br />
1<br />
2.4<br />
1.5<br />
3<br />
10<br />
00000000000000<br />
11111111111111<br />
00000000000000<br />
11111111111111<br />
00000000000000<br />
11111111111111<br />
00000000000000<br />
11111111111111<br />
00000000000000<br />
11111111111111<br />
6<br />
00000000000000<br />
11111111111111<br />
00000000000000<br />
11111111111111<br />
00000000000000<br />
11111111111111<br />
00000000000000<br />
11111111111111<br />
1 00000000000000<br />
11111111111111<br />
00000000000000000<br />
11111111111111111<br />
1.6<br />
5<br />
0000000000<br />
1111111111<br />
0000000000<br />
1111111111<br />
0000000000<br />
1111111111<br />
0000000000<br />
1111111111<br />
0000000000<br />
1111111111<br />
0000000000<br />
1111111111<br />
0000000000<br />
1111111111<br />
4<br />
0000000000<br />
1111111111<br />
0000000000<br />
1111111111<br />
2.5<br />
0000000000<br />
1111111111<br />
0000000000<br />
1111111111<br />
0000000000<br />
1111111111<br />
0000000000<br />
1111111111<br />
4.5<br />
Apiez<strong>on</strong>N<br />
GeVarnish<br />
Figure 7: Sketch <str<strong>on</strong>g>of</str<strong>on</strong>g> <strong>the</strong> experimental setup, side view.<br />
Physical Property Measurement System (PPMS) <str<strong>on</strong>g>of</str<strong>on</strong>g> Quantum Design, see [3]<br />
and [5], with <strong>the</strong> opti<strong>on</strong>al AC Transport Opti<strong>on</strong>.<br />
11
3.2 Electrical c<strong>on</strong>tacts<br />
The first task was to c<strong>on</strong>nect <strong>the</strong> sample to <strong>the</strong> already existing PPMS Resistivity<br />
Puck <strong>on</strong> which it was mounted toge<strong>the</strong>r with <strong>the</strong> rest <str<strong>on</strong>g>of</str<strong>on</strong>g> <strong>the</strong> setup.<br />
Because <str<strong>on</strong>g>of</str<strong>on</strong>g> <strong>the</strong> small dimensi<strong>on</strong>s <str<strong>on</strong>g>of</str<strong>on</strong>g> <strong>the</strong> crystal and malfuncti<strong>on</strong>ing silver<br />
epoxy this proved to be ra<strong>the</strong>r difficult. My first attempts failed utterly and<br />
when even with better silver epoxy and refined manual techniques no significant<br />
progress could be achieved, we figured that probably <strong>the</strong> surface <str<strong>on</strong>g>of</str<strong>on</strong>g> our<br />
crystal itself might be <strong>the</strong> problem. Oxygen atoms <str<strong>on</strong>g>of</str<strong>on</strong>g> <strong>the</strong> surface could have<br />
left its topmost layers, thus creating an insulating layer <strong>on</strong> <strong>the</strong> surface and<br />
raising <strong>the</strong> c<strong>on</strong>tact resistance unfavorably. In order to solve this problem, <strong>the</strong><br />
crystal was baked in an oven under an oxygen atmosphere at 460 ◦ C for seven<br />
c<strong>on</strong>secutive days, but again, <strong>the</strong> attempt to get a good c<strong>on</strong>tact to <strong>the</strong> crystal<br />
(i.e. a c<strong>on</strong>tact resistance <str<strong>on</strong>g>of</str<strong>on</strong>g> about 1 Ω), could not be achieved. The next<br />
step was <strong>the</strong>n to “rejuvenate” <strong>the</strong> surface, and <strong>the</strong> crystal was put in a 1%<br />
Bromine-Methanol soluti<strong>on</strong> for half an hour which was supposed to roughen<br />
<strong>the</strong> surface, thus making it more accessible to <strong>the</strong> anew oxygen treatment in<br />
<strong>the</strong> oven, this time at 430 ◦ C for <strong>on</strong>e day, with <strong>the</strong> c<strong>on</strong>ducting silver epoxy<br />
c<strong>on</strong>tacts already applied. This treatment proved to be successful. The new<br />
c<strong>on</strong>tacts had a resistance <str<strong>on</strong>g>of</str<strong>on</strong>g> about 1 Ω, as desired.<br />
3.3 Testphase<br />
To test <strong>the</strong> c<strong>on</strong>tacts and <strong>the</strong> proper working <str<strong>on</strong>g>of</str<strong>on</strong>g> <strong>the</strong> PPMS, <strong>the</strong> resistivity <str<strong>on</strong>g>of</str<strong>on</strong>g><br />
<strong>the</strong> crystal was first measured in zero field. The results showed that something<br />
was still wr<strong>on</strong>g, because already above <strong>the</strong> critical temperature <strong>the</strong><br />
resistance went c<strong>on</strong>siderably below zero Ohm, below T c <strong>the</strong> resistance was<br />
higher as before and after some oscillati<strong>on</strong>s even rising with decreasing temperature,<br />
thus being completely unphysical. Fur<strong>the</strong>r tests revealed that <strong>the</strong>se<br />
results where reproducible, and that <strong>the</strong> oscillati<strong>on</strong>s right below T c smoo<strong>the</strong>d<br />
out in an applied magnetic field.<br />
Doubts about <strong>the</strong> calibrati<strong>on</strong> <str<strong>on</strong>g>of</str<strong>on</strong>g> <strong>the</strong> PPMS and <strong>the</strong> intactness <str<strong>on</strong>g>of</str<strong>on</strong>g> <strong>the</strong> used<br />
puck, <strong>the</strong> measuring platform <strong>on</strong> which <strong>the</strong> sample assembly was mounted,<br />
could be excluded by measuring a piece <str<strong>on</strong>g>of</str<strong>on</strong>g> ir<strong>on</strong> as reference sample, which<br />
produced good results.<br />
The <strong>on</strong>ly o<strong>the</strong>r probable explanati<strong>on</strong> for <strong>the</strong> “negative” resistance was that<br />
<strong>the</strong> currents in <strong>the</strong> crystal, as cuprate superc<strong>on</strong>ductor, <str<strong>on</strong>g>of</str<strong>on</strong>g> course layered,<br />
took some o<strong>the</strong>r, wound paths than <strong>the</strong> expected straight <strong>on</strong>e. To sort that<br />
possibility out, I c<strong>on</strong>ducted a two-wire resistivity measurement <strong>on</strong> <strong>the</strong> crystal<br />
by removing <strong>the</strong> voltage c<strong>on</strong>tacts from <strong>the</strong> crystal and short-circuiting<br />
<strong>the</strong> voltage and current c<strong>on</strong>tacts <str<strong>on</strong>g>of</str<strong>on</strong>g> <strong>the</strong> puck. This did actually solve <strong>the</strong><br />
12
x 10 −5<br />
2<br />
0<br />
Resistance in Ohm<br />
−2<br />
−4<br />
−6<br />
−8<br />
60 70 80 90 100 110<br />
Temperature in K<br />
Figure 8: Example <str<strong>on</strong>g>of</str<strong>on</strong>g> <strong>the</strong> first unsuccessful measurements at 0 Tesla, where<br />
<strong>the</strong> resistance becomes “negative”. T c is at 96K.<br />
problem and reas<strong>on</strong>able results where obtained, that now included <strong>the</strong> additi<strong>on</strong>al<br />
resistance <str<strong>on</strong>g>of</str<strong>on</strong>g> <strong>the</strong> underground <str<strong>on</strong>g>of</str<strong>on</strong>g> <strong>the</strong> measuring setup (wires, c<strong>on</strong>tacts,<br />
...), however this led us to <strong>the</strong> believe that just <strong>the</strong> two voltage c<strong>on</strong>tacts<br />
<strong>on</strong> <strong>the</strong> crystal might have been <strong>the</strong> problem, so I remade <strong>the</strong>m, this time<br />
using a different wiring than <strong>the</strong> <strong>on</strong>e proposed in <strong>the</strong> manual. This resulted<br />
in a c<strong>on</strong>stantly positive resistance, but below T c <strong>the</strong> resistance was still too<br />
high and rising with falling temperature. C<strong>on</strong>fr<strong>on</strong>ted with this (until now<br />
unexplained) oddities we decided to do our measurements with <strong>the</strong> two-wire<br />
method, though with lower precisi<strong>on</strong>, but without this significantly unphysical<br />
behavior. Later, <strong>the</strong> coil producing <strong>the</strong> ac <str<strong>on</strong>g>shaking</str<strong>on</strong>g> field was attached to<br />
<strong>the</strong> remaining free current c<strong>on</strong>tacts <str<strong>on</strong>g>of</str<strong>on</strong>g> <strong>the</strong> puck and finally first tests with<br />
<str<strong>on</strong>g>vortex</str<strong>on</strong>g> <str<strong>on</strong>g>shaking</str<strong>on</strong>g> could be made.<br />
These did not at all meet our expectati<strong>on</strong>s, this time with a ra<strong>the</strong>r obvious<br />
reas<strong>on</strong>, I discovered that we had seriously underestimated <strong>the</strong> Lorentz forces<br />
<strong>on</strong> a coil under ac current in a 9T magnetic field. The coil was completely<br />
detached from its copper support, far away from <strong>the</strong> crystal and in a ninety<br />
degree angle to it. Obviously no <str<strong>on</strong>g>shaking</str<strong>on</strong>g> could have taken place in that manner.<br />
To prevent this from happening again, <strong>the</strong> coil was placed into a big<br />
13
droplet <str<strong>on</strong>g>of</str<strong>on</strong>g> GE-Varnish, which was <strong>the</strong>n dried in an oven at 50 ◦ C for better<br />
stability. Later, <strong>the</strong> free copper support platform <str<strong>on</strong>g>of</str<strong>on</strong>g> <strong>the</strong> coil was also attached<br />
to <strong>the</strong> sapphire disk, as <strong>the</strong> vibrati<strong>on</strong>s induced by <strong>the</strong> ac field caused<br />
<strong>the</strong> c<strong>on</strong>tacts from <strong>the</strong> coil to <strong>the</strong> puck to break. These measures were at<br />
least partially successful as <strong>the</strong> setup was now stable until fields <str<strong>on</strong>g>of</str<strong>on</strong>g> 9T main<br />
and ≈ 5 Oe ac magnetic field. Of course, <strong>the</strong> soluti<strong>on</strong> <str<strong>on</strong>g>of</str<strong>on</strong>g> this problem was<br />
instantly followed by <strong>the</strong> next <strong>on</strong>e. The following measurements where c<strong>on</strong>ducted<br />
with <strong>the</strong> parameters (x/y/z) where x stands for x mA measuring/coil<br />
current, y for y Hz measuring/<str<strong>on</strong>g>shaking</str<strong>on</strong>g> frequency and z for z sec<strong>on</strong>ds measuring/<str<strong>on</strong>g>shaking</str<strong>on</strong>g><br />
time ei<strong>the</strong>r for <strong>the</strong> resistivity measurements or <strong>the</strong> <str<strong>on</strong>g>shaking</str<strong>on</strong>g> coil.<br />
As menti<strong>on</strong>ed above, 1mA <str<strong>on</strong>g>of</str<strong>on</strong>g> current in <strong>the</strong> coil induced a magnetic field <str<strong>on</strong>g>of</str<strong>on</strong>g><br />
∼ 1.8 - 3 Oe. The first measurement with <strong>the</strong> new attachment for <strong>the</strong> coil<br />
was c<strong>on</strong>ducted at (2/1000/0.1) for <str<strong>on</strong>g>shaking</str<strong>on</strong>g>, (1/79/1) for measuring and at<br />
9T main field, and <strong>the</strong> coil attachments were stable. The results, however,<br />
showed a lot <str<strong>on</strong>g>of</str<strong>on</strong>g> unsystematic scatter in <strong>the</strong> data (see figure 9), which could<br />
not be explained and which were present also in subsequent measurements<br />
with <strong>the</strong> same parameters. Interestingly this problem could be solved by just<br />
changing <strong>the</strong> <str<strong>on</strong>g>shaking</str<strong>on</strong>g> parameters. I took <strong>the</strong> parameters that where used by<br />
Willemin et al. in <strong>the</strong>ir 1998 paper [13]: (8/581/8).<br />
Now that all <strong>the</strong> initial problems seemed to be solved, <strong>the</strong> main experiment<br />
could be started.<br />
3.4 Measurements<br />
To start with, I measured <strong>the</strong> resistance <str<strong>on</strong>g>of</str<strong>on</strong>g> <strong>the</strong> NdBCO crystal in a range<br />
from 100K to 75K, for main fields <str<strong>on</strong>g>of</str<strong>on</strong>g> 0, 1, 3, 5, 7 and 9T with parameters<br />
<str<strong>on</strong>g>of</str<strong>on</strong>g> (1/79/1) measuring and (8/581/8) <str<strong>on</strong>g>shaking</str<strong>on</strong>g>, resulting in a ac field <str<strong>on</strong>g>of</str<strong>on</strong>g> ∼<br />
18 Oe. As a reference, <strong>the</strong> resistance curves for every field strength were<br />
first measured without <strong>the</strong> activati<strong>on</strong> <str<strong>on</strong>g>of</str<strong>on</strong>g> <strong>the</strong> ac field. In <strong>the</strong> beginning, <strong>the</strong><br />
temperature was set to a 100K, far above <strong>the</strong> critical temperature <str<strong>on</strong>g>of</str<strong>on</strong>g> 96K for<br />
NdBCO, <strong>the</strong>n <strong>the</strong> field was charged and <strong>the</strong>n <strong>the</strong> resistance was measured<br />
every 0.25K, each temperature three times down to 75K. The measurements<br />
with <str<strong>on</strong>g>shaking</str<strong>on</strong>g> field were started in <strong>the</strong> same way, again every 0.25K data<br />
points were taken, now <strong>the</strong> first <strong>on</strong>e before a <str<strong>on</strong>g>shaking</str<strong>on</strong>g> took place, <strong>the</strong>n <strong>on</strong>e<br />
immediately after <strong>the</strong> <str<strong>on</strong>g>shaking</str<strong>on</strong>g> and a third <strong>on</strong>e after a 4s relaxati<strong>on</strong> time.<br />
The results <str<strong>on</strong>g>of</str<strong>on</strong>g> <strong>the</strong> run without <str<strong>on</strong>g>shaking</str<strong>on</strong>g> looked promising, pretty much as<br />
expected. Because <str<strong>on</strong>g>of</str<strong>on</strong>g> <strong>the</strong> two-wire measurement <strong>the</strong> background <str<strong>on</strong>g>of</str<strong>on</strong>g> <strong>the</strong> wires<br />
and c<strong>on</strong>tacts was <str<strong>on</strong>g>of</str<strong>on</strong>g> course still visible and <strong>the</strong>re was a slight field dependent<br />
<str<strong>on</strong>g>of</str<strong>on</strong>g>fset. After <strong>the</strong> subtracti<strong>on</strong> <str<strong>on</strong>g>of</str<strong>on</strong>g> <strong>the</strong>se unwanted parts <strong>the</strong> critical temperature<br />
and <strong>the</strong> field dependency <str<strong>on</strong>g>of</str<strong>on</strong>g> <strong>the</strong> transiti<strong>on</strong> where nicely visible in <strong>the</strong> graph<br />
(see figure 10). The results for <strong>the</strong> run with <str<strong>on</strong>g>shaking</str<strong>on</strong>g> however, were, to our<br />
14
Figure 9: Scattered data in <strong>the</strong> graph <str<strong>on</strong>g>of</str<strong>on</strong>g> <strong>the</strong> 9T (2/1000/0.1) measurement.<br />
disappointment, almost exactly <strong>the</strong> same as <strong>the</strong> <strong>on</strong>es where no <str<strong>on</strong>g>shaking</str<strong>on</strong>g> took<br />
place. A slight difference could be seen, so obviously something did happen<br />
during <strong>the</strong> <str<strong>on</strong>g>shaking</str<strong>on</strong>g>, but <strong>the</strong> difference was not nearly as big as we expected<br />
and not even reproducible or <strong>on</strong>ly at <strong>the</strong> expected places. Figure 11 shows<br />
in <strong>the</strong> upper left corner <strong>the</strong> curves for <strong>the</strong> resistivity <str<strong>on</strong>g>of</str<strong>on</strong>g> NdBCO at 7T both<br />
with active and inactive coil, which are too identical to be distinguishable<br />
from each o<strong>the</strong>r. The background is not subtracted yet. On <strong>the</strong> upper right,<br />
an enlargement <str<strong>on</strong>g>of</str<strong>on</strong>g> <strong>the</strong> regi<strong>on</strong> where <strong>the</strong> melting is expected to take place is<br />
shown, crosses representing <strong>the</strong> measurements <str<strong>on</strong>g>of</str<strong>on</strong>g> <strong>the</strong> first run without <str<strong>on</strong>g>shaking</str<strong>on</strong>g>,<br />
<strong>the</strong> stars represent in chr<strong>on</strong>ological order <strong>the</strong> measurement before <strong>the</strong><br />
<str<strong>on</strong>g>shaking</str<strong>on</strong>g>, <strong>the</strong> <strong>on</strong>e immediately after <strong>the</strong> <str<strong>on</strong>g>shaking</str<strong>on</strong>g> and <strong>on</strong>e 4s after <strong>the</strong> <str<strong>on</strong>g>shaking</str<strong>on</strong>g>.<br />
As can be seen, <strong>the</strong>re is no significant difference between <strong>the</strong> respective results.<br />
The third part <str<strong>on</strong>g>of</str<strong>on</strong>g> figure 11 <strong>on</strong> <strong>the</strong> bottom shows <strong>the</strong> difference between<br />
<strong>the</strong> curve without and <strong>the</strong> curve with <str<strong>on</strong>g>shaking</str<strong>on</strong>g>, which should <strong>the</strong>oretically be<br />
zero at <strong>the</strong> beginning and go sharply to ≈ 0.01Ω around 85K, <strong>the</strong>n again<br />
decrease to zero Ω around 80K. Obviously this is not <strong>the</strong> case. The curve<br />
oscillates always just around zero and <strong>the</strong>re is no difference below and above<br />
15
<strong>the</strong> supposed melting point. All this findings are valid for all o<strong>the</strong>r main fields<br />
too. Every measurement was repeated several times, with altered c<strong>on</strong>tacts,<br />
different wirings <str<strong>on</strong>g>of</str<strong>on</strong>g> <strong>the</strong> crystal and <strong>the</strong> coil and even <strong>on</strong> different machines,<br />
but <strong>the</strong> results were always <strong>the</strong> same: no difference between data taken with<br />
or without <str<strong>on</strong>g>shaking</str<strong>on</strong>g> could be found.<br />
Figure 10: Results for <strong>the</strong> measurements <str<strong>on</strong>g>of</str<strong>on</strong>g> <strong>the</strong> resistance <str<strong>on</strong>g>of</str<strong>on</strong>g> NdBCO without<br />
<str<strong>on</strong>g>shaking</str<strong>on</strong>g>. Background and <str<strong>on</strong>g>of</str<strong>on</strong>g>fset distracted.<br />
One <str<strong>on</strong>g>of</str<strong>on</strong>g> <strong>the</strong> circumstances suspected to be <strong>the</strong> reas<strong>on</strong> for this were <strong>the</strong><br />
parameters <str<strong>on</strong>g>of</str<strong>on</strong>g> <strong>the</strong> <str<strong>on</strong>g>shaking</str<strong>on</strong>g>, which could lead to a too weak or even too str<strong>on</strong>g<br />
<str<strong>on</strong>g>shaking</str<strong>on</strong>g>. So several tests with different <str<strong>on</strong>g>shaking</str<strong>on</strong>g> parameters where executed<br />
next. For <strong>the</strong> main field I chose a smaller magnetic field (5T) as before,<br />
to avoid tearing <strong>the</strong> coil loose again and <strong>the</strong> temperature was set to 100,<br />
90 and 85K with a full set <str<strong>on</strong>g>of</str<strong>on</strong>g> measurements for each temperature. At first<br />
<strong>the</strong> amplitude <str<strong>on</strong>g>of</str<strong>on</strong>g> <strong>the</strong> coil current was changed, currents <str<strong>on</strong>g>of</str<strong>on</strong>g> 2, 4, 8, 12 and<br />
16mA where tested, corresp<strong>on</strong>ding to ac-field strengths <str<strong>on</strong>g>of</str<strong>on</strong>g> 4 to 36Oe, <strong>the</strong>n<br />
several different frequencies were measured (59, 231, 367, 457, 581, 787,<br />
997Hz) and finally <strong>the</strong> <str<strong>on</strong>g>shaking</str<strong>on</strong>g> time was altered (1, 2, 4, 6, 8, 10s). N<strong>on</strong>e<br />
<str<strong>on</strong>g>of</str<strong>on</strong>g> <strong>the</strong>se diverse parameters lead to a different result than <strong>the</strong> <strong>on</strong>e already<br />
known. The <strong>on</strong>ly insight gained, was that <strong>the</strong> resistance <str<strong>on</strong>g>of</str<strong>on</strong>g> <strong>the</strong> NdBCO<br />
crystal depended quite heavily <strong>on</strong> <strong>the</strong> frequency used, but as later similar<br />
measurements proved, <strong>the</strong>re was no general rule to describe that properly.<br />
The first time it was measured, <strong>the</strong> resistance got slightly lower with higher<br />
frequencies, <strong>the</strong> sec<strong>on</strong>d time, after some weeks and hence not with exactly<br />
<strong>the</strong> same setup, <strong>the</strong> resistance grew quite heavily, almost quadratic, with<br />
16
0.49<br />
0.48<br />
0.47<br />
0.4345<br />
0.434<br />
Resistance im Ohm<br />
0.46<br />
0.45<br />
0.44<br />
0.43<br />
0.42<br />
0.41<br />
0.4<br />
0.4335<br />
0.433<br />
0.4325<br />
0.432<br />
0.39<br />
70 80 90 100 110<br />
85 85.2 85.4 85.6 85.8<br />
10 x 10−4 Temp in K<br />
∆ Ω<br />
5<br />
0<br />
−5<br />
70 75 80 85 90 95 100 105<br />
Figure 11: Results for <strong>the</strong> measurements at 7T with and without <str<strong>on</strong>g>shaking</str<strong>on</strong>g>.<br />
Upper right: Zoom into <strong>the</strong> regi<strong>on</strong> <str<strong>on</strong>g>of</str<strong>on</strong>g> <strong>the</strong> melting transiti<strong>on</strong>. Crosses representing<br />
<strong>the</strong> run without <str<strong>on</strong>g>shaking</str<strong>on</strong>g>, stars <strong>the</strong> run with <str<strong>on</strong>g>shaking</str<strong>on</strong>g>. Bottom:<br />
Difference between <strong>the</strong> normal and <strong>the</strong> resistance with <str<strong>on</strong>g>shaking</str<strong>on</strong>g>.<br />
higher frequencies. Probably <strong>the</strong>se dependencies came not <strong>on</strong>ly from <strong>the</strong><br />
17
x 10 −4<br />
3<br />
2<br />
1<br />
∆ Resistance in Ohm<br />
0<br />
−1<br />
−2<br />
−3<br />
−4<br />
−5<br />
−6<br />
75 80 85 90 95 100<br />
Temperature in K<br />
Figure 12: This figure shows <strong>the</strong> difference between measurements with and<br />
without <str<strong>on</strong>g>shaking</str<strong>on</strong>g> for 9T main field. Obviously, <strong>the</strong> <str<strong>on</strong>g>shaking</str<strong>on</strong>g> did not have an<br />
observable effect.<br />
crystal itself, but also from effects <strong>the</strong> frequency had <strong>on</strong> <strong>the</strong> coil and <strong>on</strong> <strong>the</strong><br />
measurement method.<br />
Up to this stage <str<strong>on</strong>g>of</str<strong>on</strong>g> our investigati<strong>on</strong>s, every measurement was taken after a<br />
certain <str<strong>on</strong>g>shaking</str<strong>on</strong>g> period, because <strong>the</strong> PPMS could not measure two samples at<br />
<strong>the</strong> same time, which was <strong>the</strong>oretically not a disadvantage, but at that time<br />
this was regarded as a probable reas<strong>on</strong> for <strong>the</strong> null-results. So <strong>the</strong> setup <str<strong>on</strong>g>of</str<strong>on</strong>g><br />
<strong>the</strong> experiment was changed to allow a simultaneous <str<strong>on</strong>g>shaking</str<strong>on</strong>g> and measuring.<br />
This was d<strong>on</strong>e by placing <strong>the</strong> coil in series to <strong>the</strong> measuring current circuit.<br />
Naturally this design did not allow measurements without <str<strong>on</strong>g>shaking</str<strong>on</strong>g> anymore<br />
and so fur<strong>the</strong>r <strong>on</strong> <strong>on</strong>ly <strong>on</strong>e set <str<strong>on</strong>g>of</str<strong>on</strong>g> parameters is needed as <strong>the</strong> <str<strong>on</strong>g>shaking</str<strong>on</strong>g> and<br />
measuring currents are now <strong>the</strong> same. The first measurements <str<strong>on</strong>g>of</str<strong>on</strong>g> this type<br />
were again c<strong>on</strong>ducted with (8/581/8) and at 5T. In this setup <strong>the</strong> system had<br />
18
some problems in finding an appropriate gain and had to switch it several<br />
times during <strong>on</strong>e run, leading to unstable measuring results. As a few tests<br />
revealed, this could be fixed by just changing <strong>the</strong> parameters to (8/231/8),<br />
proving <strong>the</strong> frequency dependence <str<strong>on</strong>g>of</str<strong>on</strong>g> <strong>the</strong> resistance again. The gain was<br />
stable until roughly 300Hz and <strong>the</strong>n became more and more unstable. Now<br />
that we did not have a reference measurement for <strong>the</strong> sample in <strong>the</strong> natural<br />
disequilibrium state we needed to know what we where looking for in our<br />
measured curves. We would expect a relatively sharp drop <str<strong>on</strong>g>of</str<strong>on</strong>g> <strong>the</strong> resistance<br />
in <strong>the</strong> last third <str<strong>on</strong>g>of</str<strong>on</strong>g> <strong>the</strong> n<strong>on</strong>-zero resistance part <str<strong>on</strong>g>of</str<strong>on</strong>g> <strong>the</strong> superc<strong>on</strong>ducting phase,<br />
just below <strong>the</strong> melting transiti<strong>on</strong>, in c<strong>on</strong>trast to a smooth curve. But again,<br />
no feature <str<strong>on</strong>g>of</str<strong>on</strong>g> this kind could be seen, although <strong>the</strong> same set <str<strong>on</strong>g>of</str<strong>on</strong>g> measurements<br />
as with <strong>the</strong> previous measurements had been performed.<br />
3.5 A New Material...<br />
As it became obvious that <strong>the</strong> remaining time would not be sufficient to plan<br />
and c<strong>on</strong>duct a totally new setup to solve our problem with NdBCO, which<br />
would have involved a time c<strong>on</strong>suming modificati<strong>on</strong> <str<strong>on</strong>g>of</str<strong>on</strong>g> <strong>the</strong> chr<strong>on</strong>ically fully<br />
booked PPMS, we decided to try a similar task with a quite different material:<br />
LuNi 2 B 2 C, being an intermetallic compound (instead <str<strong>on</strong>g>of</str<strong>on</strong>g> a cuprate) <str<strong>on</strong>g>of</str<strong>on</strong>g> <strong>the</strong><br />
form Ln-Tr-B-C, where Ln is a lanthanide element (Y, Ho - Lu) and Tr a<br />
transiti<strong>on</strong> metal (Pd or Ni). It is a type-II superc<strong>on</strong>ductor with a transiti<strong>on</strong><br />
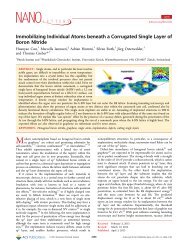
temperature <str<strong>on</strong>g>of</str<strong>on</strong>g> ≈ 16.6K. This compound is not layered as <strong>the</strong> copper oxides<br />
are, but instead shows a 3D-structure, as shown in figure 13.<br />
In LuNi 2 B 2 C, we were looking for a possible feature in <strong>the</strong> resistance<br />
just below T c , where peaks have seen in measurements <str<strong>on</strong>g>of</str<strong>on</strong>g> <strong>the</strong> specific heat<br />
by M. Reibelt, a Ph.D. Student <str<strong>on</strong>g>of</str<strong>on</strong>g> our group.<br />
The first tests were d<strong>on</strong>e with a two-wire measurement, just to find <strong>the</strong> right<br />
orientati<strong>on</strong> <str<strong>on</strong>g>of</str<strong>on</strong>g> <strong>the</strong> crystal with respect to <strong>the</strong> field, and <strong>the</strong> coil was again<br />
placed in series with <strong>the</strong> measuring current circuit. To my surprise <strong>the</strong>se<br />
measurements showed again resistance values that were negative, this time<br />
even with <strong>the</strong> two-wire method, and had a strange temperature dependence.<br />
To check <strong>the</strong>se results I switched from <strong>the</strong> AC Opti<strong>on</strong> to <strong>the</strong> Resistivity<br />
Opti<strong>on</strong> <str<strong>on</strong>g>of</str<strong>on</strong>g> <strong>the</strong> PPMS and repeated <strong>the</strong> measurements. Now <strong>the</strong> resistance<br />
values came out positive, but <strong>the</strong> temperature dependence was still not as<br />
it should be. Instead <str<strong>on</strong>g>of</str<strong>on</strong>g> a general decrease with falling temperature, <strong>the</strong> resistance<br />
was growing heavily down to T c , <strong>the</strong>n dropped sharply for a while,<br />
and began <strong>the</strong>n to rise again. At higher magnetic fields <strong>the</strong> transiti<strong>on</strong> could<br />
not even be found until 3K. But this time we had several pieces <str<strong>on</strong>g>of</str<strong>on</strong>g> <strong>the</strong> same<br />
crystal at our disposal, so I took ano<strong>the</strong>r <strong>on</strong>e with a different surface and<br />
surface orientati<strong>on</strong> and made it ready for a four-wire measurement, to make<br />
19
Figure 13: The crystal structure <str<strong>on</strong>g>of</str<strong>on</strong>g> LuNi 2 B 2 C. Filled circles are Ni atoms,<br />
<strong>the</strong> largest open circles are Lu atoms. The Ni-B-C framework is indicated<br />
by <strong>the</strong> b<strong>on</strong>ds between <strong>the</strong> atoms. [26]<br />
sure that <strong>the</strong> crystal was not <strong>the</strong> source <str<strong>on</strong>g>of</str<strong>on</strong>g> <strong>the</strong> problem. The c<strong>on</strong>tact resistance<br />
was good from <strong>the</strong> beginning, ≈ 2Ω, and no fur<strong>the</strong>r preparati<strong>on</strong> <str<strong>on</strong>g>of</str<strong>on</strong>g> <strong>the</strong><br />
crystal was needed as it was <strong>the</strong> case with <strong>the</strong> NdBCO crystal. But also<br />
this sec<strong>on</strong>d piece with a completely new four-wire c<strong>on</strong>necti<strong>on</strong> and a separate<br />
c<strong>on</strong>necti<strong>on</strong> for <strong>the</strong> coil displayed <strong>the</strong> same results, as shown in figure 14 and<br />
15. And again, <str<strong>on</strong>g>shaking</str<strong>on</strong>g> did not make any serious difference.<br />
3.6 ...and a new <str<strong>on</strong>g>shaking</str<strong>on</strong>g> technique<br />
The last series <str<strong>on</strong>g>of</str<strong>on</strong>g> tests that we made after we started with <strong>the</strong> LuNi 2 B 2 C<br />
crystal involved a new <str<strong>on</strong>g>shaking</str<strong>on</strong>g> technique, which was already used by M.<br />
Reibelt for his experiments <strong>on</strong> <strong>the</strong> LuNiBC crystals. To bring <strong>the</strong> vortices<br />
into <strong>the</strong>ir equilibrium state, he used a method first menti<strong>on</strong>ed by G. Ravikumari<br />
et al. [27]. They did not use an ac magnetic field perpendicular to <strong>the</strong><br />
main field to shake <strong>the</strong> vortices, but instead <strong>the</strong>y applied a number <str<strong>on</strong>g>of</str<strong>on</strong>g> small<br />
cycling loops <str<strong>on</strong>g>of</str<strong>on</strong>g> <strong>the</strong> main field prior to a measurement to <strong>the</strong> crystal. To<br />
20
2.53 x 10⁻⁴ 0 to 7T<br />
2.52<br />
Resistance in Ohm<br />
2.51<br />
2.5<br />
2.49<br />
7T<br />
0T<br />
2.48<br />
2.47<br />
4 6 8 10 12 14 16 18 20<br />
Temperature in K<br />
Figure 14: Temperature vs Resistance <str<strong>on</strong>g>of</str<strong>on</strong>g> <strong>the</strong> LuNiBC crystal from 0 to 7T,<br />
with <str<strong>on</strong>g>shaking</str<strong>on</strong>g>.<br />
explain this effect we <strong>on</strong>ce again need Bean’s critical state model [19], but<br />
this time it needs to be altered so that J c becomes a history dependent J c,<br />
′<br />
in order to be compatible with experimental facts. The details are explained<br />
in <strong>the</strong> paper <str<strong>on</strong>g>of</str<strong>on</strong>g> G. Ravikumari et al. [27], where <strong>the</strong>y come to <strong>the</strong> c<strong>on</strong>clusi<strong>on</strong><br />
that J c ′ = J c +(|∆B|/B r )(Jc st −J c), where <strong>the</strong> parameters Jc<br />
st (stable current<br />
density) and B r (retardati<strong>on</strong> parameter) are <strong>on</strong>ly assumed to be uniquely<br />
determined by B and T. The c<strong>on</strong>sequences <str<strong>on</strong>g>of</str<strong>on</strong>g> this new J c ′ are, that it allows<br />
J c to depend <strong>on</strong> <strong>the</strong> magnetic history <str<strong>on</strong>g>of</str<strong>on</strong>g> <strong>the</strong> system, <strong>the</strong>reby lifting <strong>the</strong> restricti<strong>on</strong><br />
<strong>on</strong> <strong>the</strong> uniqueness <str<strong>on</strong>g>of</str<strong>on</strong>g> J c imposed in <strong>the</strong> Bean model and that J c can<br />
be different from Jc<br />
st but that such a state is metastable. The metastable J c<br />
is driven to its stable value Jc<br />
st by a change in <strong>the</strong> local field B, independent<br />
<str<strong>on</strong>g>of</str<strong>on</strong>g> its sign, as ensured by <strong>the</strong> absolute value |∆B| in J c. ′ This evoluti<strong>on</strong> <str<strong>on</strong>g>of</str<strong>on</strong>g><br />
J c is shown schematically in secti<strong>on</strong> (i) <str<strong>on</strong>g>of</str<strong>on</strong>g> figure 16, when <strong>the</strong> initial J c is<br />
both larger and smaller than Jc<br />
st and for both increasing and decreasing B<br />
from <strong>the</strong> ambient value in each case. Additi<strong>on</strong>ally, secti<strong>on</strong> (ii) <str<strong>on</strong>g>of</str<strong>on</strong>g> figure 16<br />
shows a similar approach to Jc st , when <strong>the</strong> field is cycled. Physically, we may<br />
imagine that in <strong>the</strong> absence <str<strong>on</strong>g>of</str<strong>on</strong>g> <strong>the</strong>rmal fluctuati<strong>on</strong>s it is <strong>the</strong> change in local<br />
field B that can move <strong>the</strong> vortices from <strong>the</strong>ir metastable c<strong>on</strong>figurati<strong>on</strong> into<br />
21
2.502 x 10⁻⁴ 2T<br />
2.5<br />
2.498<br />
Resistance in Ohm<br />
2.496<br />
2.494<br />
2.492<br />
2.49<br />
4 6 8 10 12 14 16 18 20<br />
Temperature in K<br />
Figure 15: Temperature vs Resistance <str<strong>on</strong>g>of</str<strong>on</strong>g> <strong>the</strong> LuNiBC crystal at 2T, with<br />
<str<strong>on</strong>g>shaking</str<strong>on</strong>g>. × represent pre-<str<strong>on</strong>g>shaking</str<strong>on</strong>g> results, + results after <str<strong>on</strong>g>shaking</str<strong>on</strong>g>. The dotted<br />
line follows <strong>the</strong> × as an aid.<br />
<strong>the</strong> stable <strong>on</strong>e [27]. So much for <strong>the</strong> <strong>the</strong>ory.<br />
The setup was <strong>the</strong> same as before (four-wire measurement, but no coil) and<br />
<strong>the</strong> experiment was <strong>the</strong>n c<strong>on</strong>ducted as follows: From <strong>the</strong> measurements <str<strong>on</strong>g>of</str<strong>on</strong>g><br />
M. Reibelt is was known that <strong>the</strong> peak <strong>on</strong>ly showed after some dozens <str<strong>on</strong>g>of</str<strong>on</strong>g> field<br />
cycles or if <strong>the</strong> sample was cooled down very fast (-200mK/s), if <strong>the</strong> sample<br />
was slowly cooled (-0.2mK/s) and no cycles where made, <strong>the</strong> peak has not<br />
been visible. So <strong>the</strong> first run was <strong>on</strong>e with slow cooling and no field cycles.<br />
The sample was first cooled to 18K, <strong>the</strong>n a field <str<strong>on</strong>g>of</str<strong>on</strong>g> µ 0 H = 2.5T was applied.<br />
The fur<strong>the</strong>r cooling was made with a dT/dt <str<strong>on</strong>g>of</str<strong>on</strong>g> -0.2mK/s down to 4.3K. The<br />
resistivity was <strong>the</strong>n measured from 4.3 to 11K in small steps. When this was<br />
d<strong>on</strong>e, <strong>the</strong> sample was again heated to 18K to bring it back into its initial<br />
state. The next run was again slow cooling and involved 60 cycles <str<strong>on</strong>g>of</str<strong>on</strong>g> <strong>the</strong><br />
main magnetic field with a µ 0 ∆H = 0.1T (i.e. from 2.5 to 2.6T and back<br />
again). Runs number 3 and 4 where both with fast cooling (-200mK/s),<br />
22
Figure 16: To approach <str<strong>on</strong>g>of</str<strong>on</strong>g> <strong>the</strong> current density J c towards Jc<br />
st is schematically<br />
shown as a functi<strong>on</strong> <str<strong>on</strong>g>of</str<strong>on</strong>g> field B for a fixed Jc st . (i) At point A, J c > Jc<br />
st and J c<br />
decreases when <strong>the</strong> field is increased (path b) or decreased (path a). Similarly,<br />
at point C, J c < Jc st and J c increases when <strong>the</strong> field is increased (path d)<br />
or decreased (path c). (ii) The same is shown under <strong>the</strong> applicati<strong>on</strong> <str<strong>on</strong>g>of</str<strong>on</strong>g> an<br />
oscillatory field. [27]<br />
number 3 without cycles, run 4 with 60 cycles. The results, as expected,<br />
still showed <strong>the</strong> strange temperature dependence <strong>the</strong> sample had exhibited<br />
in earlier measurements, but <strong>the</strong>se runs involving a cycling <str<strong>on</strong>g>of</str<strong>on</strong>g> <strong>the</strong> field did<br />
actually show a clearly visible feature in resistivity which <strong>the</strong> runs without<br />
cycling did not show. Figure 17 shows <strong>the</strong> results for <strong>the</strong> two slow cooling<br />
measurements, where <strong>the</strong> feature can be seen at ≈ 9.8K. In <strong>the</strong> next figures,<br />
figures 18 and 19 and figures 23 and 24 in <strong>the</strong> appendix, <strong>the</strong> additi<strong>on</strong>al,<br />
approximately quadratic, rise in resistance has been subtracted for better<br />
clarity. It can easily be seen in figure 24 that in our case <strong>the</strong> velocity <str<strong>on</strong>g>of</str<strong>on</strong>g> <strong>the</strong><br />
cooling did not have an effect, as it had in <strong>the</strong> specific heat measurements.<br />
Figure 19 shows an enlargement <str<strong>on</strong>g>of</str<strong>on</strong>g> <strong>the</strong> area around <strong>the</strong> peak in <strong>the</strong> cycling<br />
runs, showing that <strong>the</strong> feature is pretty good reproducible.<br />
This was <strong>the</strong> last measurement d<strong>on</strong>e and c<strong>on</strong>cluded <strong>the</strong> experimental phase<br />
<str<strong>on</strong>g>of</str<strong>on</strong>g> <strong>the</strong> work.<br />
23
Figure 17: Results for <strong>the</strong> two slow cooling measurements, <strong>the</strong> feature can<br />
be seen at ≈ 9.8K.<br />
24
Figure 18: Results <str<strong>on</strong>g>of</str<strong>on</strong>g> <strong>the</strong> sec<strong>on</strong>d LuNiBC experiments. Adjusted data for all<br />
four runs.<br />
25
Figure 19: Zoom into <strong>the</strong> area around <strong>the</strong> feature. Within <strong>the</strong> experimental<br />
scatter, <strong>the</strong> two features (after fast and slow cooling) are nearly identical.<br />
26
4 Interpretati<strong>on</strong> and C<strong>on</strong>clusi<strong>on</strong><br />
4.1 NdBa 2 Cu 3 O 7−d<br />
As discussed earlier, no melting transiti<strong>on</strong> could be found in NdBCO, i.e. we<br />
could not distinguish between measurements with or without <str<strong>on</strong>g>shaking</str<strong>on</strong>g>. Of<br />
course, this can be due to many very different reas<strong>on</strong>s. The most obvious<br />
would be that <strong>the</strong> <str<strong>on</strong>g>shaking</str<strong>on</strong>g> itself did not work, due to a malfuncti<strong>on</strong>ing coil<br />
or inadequate <str<strong>on</strong>g>shaking</str<strong>on</strong>g> parameters. But as far as I can say, <strong>the</strong> coil was<br />
working fine. There was definitely an ac current flowing in it, as <strong>the</strong> str<strong>on</strong>g<br />
Lorentz force it experienced and <strong>the</strong> resistivity measurements that were d<strong>on</strong>e<br />
automatically <strong>on</strong> <strong>the</strong> coil have proved. There is no reas<strong>on</strong> why <strong>the</strong> coil should<br />
not have induced a magnetic field and indeed a tiny difference between each<br />
<str<strong>on</strong>g>of</str<strong>on</strong>g> <strong>the</strong> separate runs could actually be seen, as menti<strong>on</strong>ed in <strong>the</strong> first part <str<strong>on</strong>g>of</str<strong>on</strong>g><br />
3.4, but <str<strong>on</strong>g>of</str<strong>on</strong>g> course it was not nearly <str<strong>on</strong>g>of</str<strong>on</strong>g> <strong>the</strong> magnitude we expected. This brings<br />
us to <strong>the</strong> <str<strong>on</strong>g>shaking</str<strong>on</strong>g> parameters. Within <strong>the</strong> limits <str<strong>on</strong>g>of</str<strong>on</strong>g> our technical possibilities<br />
I tried every reas<strong>on</strong>able combinati<strong>on</strong> <str<strong>on</strong>g>of</str<strong>on</strong>g> applied current (i.e. field strength),<br />
frequency and <str<strong>on</strong>g>shaking</str<strong>on</strong>g> time (i.e. number <str<strong>on</strong>g>of</str<strong>on</strong>g> <str<strong>on</strong>g>vortex</str<strong>on</strong>g> “steps”), but not <strong>on</strong>e <str<strong>on</strong>g>of</str<strong>on</strong>g><br />
<strong>the</strong>m was successful. Additi<strong>on</strong>ally <strong>on</strong>e can add that <strong>the</strong> used parameters had<br />
already been proved to be working by Willemin et al. in <strong>the</strong>ir experiments.<br />
I c<strong>on</strong>clude that <strong>the</strong> <str<strong>on</strong>g>shaking</str<strong>on</strong>g> was working properly and <strong>the</strong> reas<strong>on</strong> that no<br />
difference in resistance showed up has to be elsewhere. A. K. Pradhan et al.<br />
report in <strong>the</strong>ir 1999 paper [28] that <strong>the</strong>y encountered a str<strong>on</strong>g dependence <str<strong>on</strong>g>of</str<strong>on</strong>g><br />
<strong>the</strong> transiti<strong>on</strong> <strong>on</strong> <strong>the</strong> oxygen partial pressure during <strong>the</strong> growth <str<strong>on</strong>g>of</str<strong>on</strong>g> <strong>the</strong> crystal.<br />
They measured “a smeared first-order melting transiti<strong>on</strong> (FOT) for 0.01 and<br />
a distinct FOT for 0.03% and 0.05%, and a c<strong>on</strong>tinuous transiti<strong>on</strong> for 0.07%<br />
[O 2 partial pressure to Ar atmosphere during growth]”. It is not known to me<br />
in what percentage <str<strong>on</strong>g>of</str<strong>on</strong>g> O 2 our crystal was grown. Additi<strong>on</strong>ally, as menti<strong>on</strong>ed<br />
in sub-chapter 3.2, we treated it with a 1% Bromine-Methanol soluti<strong>on</strong> and<br />
had it in an oven under oxygen atmosphere to improve its surface, so it is quite<br />
possible that <strong>the</strong> crystals surface was under c<strong>on</strong>diti<strong>on</strong>s similar to <strong>the</strong> crystals<br />
<str<strong>on</strong>g>of</str<strong>on</strong>g> Pradhan with 0.07% O 2 partial pressure, which means that <strong>the</strong> transiti<strong>on</strong><br />
<str<strong>on</strong>g>of</str<strong>on</strong>g> our crystal was not distinct as expected, but instead actually genuinely<br />
c<strong>on</strong>tinuous and <strong>the</strong> <str<strong>on</strong>g>vortex</str<strong>on</strong>g> <str<strong>on</strong>g>shaking</str<strong>on</strong>g> could not have had an effect. As <strong>the</strong><br />
magnitude <str<strong>on</strong>g>of</str<strong>on</strong>g> disorder <str<strong>on</strong>g>of</str<strong>on</strong>g> both crystals, <strong>the</strong> NdBCO and <strong>the</strong> LuNiBC, was as<br />
well not known, it is also possible, that <strong>the</strong> pinning forces in <strong>the</strong> crystals were<br />
too str<strong>on</strong>g for any kind <str<strong>on</strong>g>of</str<strong>on</strong>g> <str<strong>on</strong>g>vortex</str<strong>on</strong>g> <str<strong>on</strong>g>shaking</str<strong>on</strong>g>, as <str<strong>on</strong>g>vortex</str<strong>on</strong>g> <str<strong>on</strong>g>shaking</str<strong>on</strong>g> is normally <strong>on</strong>ly<br />
used in just slightly disordered crystals, where <strong>the</strong> vortices are not far away<br />
from equilibrium. The most fundamental questi<strong>on</strong> is at last, if <str<strong>on</strong>g>vortex</str<strong>on</strong>g> <str<strong>on</strong>g>shaking</str<strong>on</strong>g><br />
influences resistivity measurements at all, this questi<strong>on</strong> arises because <str<strong>on</strong>g>of</str<strong>on</strong>g> <strong>the</strong><br />
fact, that resistivity measurements need a current, which does naturally not<br />
27
esult a real equilibrium. The measuring currents might in fact destroy <strong>the</strong><br />
effects <str<strong>on</strong>g>of</str<strong>on</strong>g> <strong>the</strong> <str<strong>on</strong>g>shaking</str<strong>on</strong>g> immediately. In order to prove this <strong>the</strong>sis, resistivity<br />
experiments should be made with crystals where <strong>the</strong> melting transiti<strong>on</strong> has<br />
already been found with magnetizati<strong>on</strong> measurements or similar methods,<br />
where <strong>the</strong> measurement itself does not destroy <strong>the</strong> equilibrium.<br />
4.2 LuNi 2 B 2 C<br />
In <strong>the</strong> beginning, <strong>the</strong> LuNi 2 B 2 C measurements showed <strong>the</strong> same unsatisfactory<br />
results as NdBCO, plus a peculiar temperature dependence seen in<br />
figure 14. For <strong>the</strong> effects <str<strong>on</strong>g>of</str<strong>on</strong>g> <str<strong>on</strong>g>shaking</str<strong>on</strong>g> <strong>the</strong> same arguments as before are again<br />
applicable, but <strong>the</strong> unexpected temperature dependence is even more difficult<br />
to explain. Later measurements (not described here) with <strong>the</strong> same<br />
setup, but again <strong>on</strong> <strong>the</strong> sec<strong>on</strong>d PPMS, did no l<strong>on</strong>ger show <strong>the</strong> “S” shaped<br />
curves that are caused by <strong>the</strong> <strong>on</strong>set <str<strong>on</strong>g>of</str<strong>on</strong>g> superc<strong>on</strong>ductivity and <strong>the</strong> quadratic<br />
slope as in <strong>the</strong> first measurements, <strong>the</strong> superc<strong>on</strong>ducting transiti<strong>on</strong> could not<br />
even be found any more. This leads me to believe that <strong>the</strong> crystal, or at least<br />
it surface, must have become n<strong>on</strong>-superc<strong>on</strong>ducting, most probably because<br />
<str<strong>on</strong>g>of</str<strong>on</strong>g> <strong>the</strong> silver epoxy c<strong>on</strong>tacts, which also may have caused <strong>the</strong> increase <str<strong>on</strong>g>of</str<strong>on</strong>g> <strong>the</strong><br />
resistivity with falling temperature.<br />
Now to <strong>the</strong> sec<strong>on</strong>d part <str<strong>on</strong>g>of</str<strong>on</strong>g> <strong>the</strong> LuNi 2 B 2 C experiment. Naturally it is <strong>the</strong><br />
topmost questi<strong>on</strong> why this feature arises and especially why it is an upward<br />
and not a downward peak as our <str<strong>on</strong>g>vortex</str<strong>on</strong>g> <str<strong>on</strong>g>shaking</str<strong>on</strong>g> <strong>the</strong>ory proposes. A sec<strong>on</strong>d<br />
questi<strong>on</strong> arises from <strong>the</strong> comparis<strong>on</strong> with <strong>the</strong> data from M. Reibelt. His<br />
peak in <strong>the</strong> specific heat for 2.5T is at ≈ 10.5K while <strong>the</strong> peak seen here is<br />
at 9.8K. This might just be due to different <strong>the</strong>rmometer calibrati<strong>on</strong>s, but a<br />
comparis<strong>on</strong> <str<strong>on</strong>g>of</str<strong>on</strong>g> ∆T, <strong>the</strong> difference between T c and <strong>the</strong> peak positi<strong>on</strong>, shows<br />
that his peak is quite closer to T c as our feature, ∆T (cp) ≈ 0 − 0.4K, where<br />
∆T (Ω) ≈ 1.2K. So we might in fact have found ano<strong>the</strong>r effect that is resp<strong>on</strong>sible<br />
for our feature. Let us return to <strong>the</strong> first questi<strong>on</strong>, which could be <strong>the</strong><br />
answer to this questi<strong>on</strong> as well. The fact that <strong>the</strong> feature is an increase in<br />
resistance instead <str<strong>on</strong>g>of</str<strong>on</strong>g> a drop and at a c<strong>on</strong>siderably lower temperature as <strong>the</strong><br />
suspected melting transiti<strong>on</strong> is probably an indicati<strong>on</strong> that <strong>the</strong> sample was<br />
still not in equilibrium state. But a well-founded explanati<strong>on</strong> for this effect<br />
can not be given without more experiments and more <strong>the</strong>oretical knowledge.<br />
It can <strong>on</strong>ly be stated here, that <strong>the</strong> magnetic history <str<strong>on</strong>g>of</str<strong>on</strong>g> <strong>the</strong> sample had in fact<br />
a c<strong>on</strong>siderable effect <strong>on</strong> <strong>the</strong> measured resistivity, which supports <strong>the</strong> findings<br />
<str<strong>on</strong>g>of</str<strong>on</strong>g> M. Reibelt.<br />
I’d like to thank Pr<str<strong>on</strong>g>of</str<strong>on</strong>g>. Schilling for <strong>the</strong> possibility to do this <strong>the</strong>sis and his<br />
supervisi<strong>on</strong>, and his group and o<strong>the</strong>r members <str<strong>on</strong>g>of</str<strong>on</strong>g> <strong>the</strong> institute for <strong>the</strong>ir kind<br />
help.<br />
28
5 Appendix<br />
Figure 20: In-plane resistance ρ(H, T) <str<strong>on</strong>g>of</str<strong>on</strong>g> a clean high-temperature superc<strong>on</strong>ductor.<br />
After [28].<br />
Figure 21: In-plane resistance ρ(H, T) <str<strong>on</strong>g>of</str<strong>on</strong>g> a high-temperature superc<strong>on</strong>ductor<br />
with pinning centers, without <str<strong>on</strong>g>shaking</str<strong>on</strong>g>.<br />
29
11 10.5 9 8.5 7 4 2.5 2<br />
13.5<br />
12.5<br />
11<br />
7.5<br />
6.5<br />
4.5<br />
2.5<br />
0.5<br />
00000000000000000000000<br />
11111111111111111111111<br />
00000000000000000000000<br />
11111111111111111111111<br />
00000000000000000000000<br />
11111111111111111111111<br />
00000000000000000000000<br />
11111111111111111111111<br />
00000000000000000000000<br />
11111111111111111111111<br />
00000000000000000000000<br />
11111111111111111111111<br />
00000000000000000000000<br />
11111111111111111111111<br />
00000000000000000000000<br />
11111111111111111111111<br />
00000000000000000000000<br />
11111111111111111111111<br />
00000000000000000000000<br />
11111111111111111111111<br />
00000000000000000000000<br />
11111111111111111111111<br />
00000000000000000000000<br />
11111111111111111111111<br />
00000000000000000000000<br />
11111111111111111111111<br />
Figure 22: Sketch <str<strong>on</strong>g>of</str<strong>on</strong>g> <strong>the</strong> experimental setup, top view.<br />
30
Figure 23: Comparis<strong>on</strong> <str<strong>on</strong>g>of</str<strong>on</strong>g> fast and slow cooling in <strong>the</strong> sec<strong>on</strong>d LuNi 2 B 2 C<br />
experiment. The feature at 9.8K is both times clearly visible.<br />
31
Figure 24: Comparis<strong>on</strong> <str<strong>on</strong>g>of</str<strong>on</strong>g> runs without and with cycling. The upper figure<br />
shows that <strong>the</strong> velocity <str<strong>on</strong>g>of</str<strong>on</strong>g> cooling did not make a difference.<br />
32
List <str<strong>on</strong>g>of</str<strong>on</strong>g> Figures<br />
1 Shubnikov-Phase (“mixed state”) in a Type II superc<strong>on</strong>ductor<br />
with <strong>the</strong> Abrikosov lattice. . . . . . . . . . . . . . . . . . . . . 3<br />
2 Phase diagrams <str<strong>on</strong>g>of</str<strong>on</strong>g> a c<strong>on</strong>venti<strong>on</strong>al low temperature and a high<br />
T c type-II superc<strong>on</strong>ductor. . . . . . . . . . . . . . . . . . . . . 4<br />
3 Visualizati<strong>on</strong> <str<strong>on</strong>g>of</str<strong>on</strong>g> <strong>the</strong> transverse and l<strong>on</strong>gitudinal <str<strong>on</strong>g>vortex</str<strong>on</strong>g> <str<strong>on</strong>g>shaking</str<strong>on</strong>g>.<br />
In both geometries <strong>the</strong> vortices drift towards <strong>the</strong> center<br />
<str<strong>on</strong>g>of</str<strong>on</strong>g> <strong>the</strong> strip. Shown is <strong>on</strong>e <str<strong>on</strong>g>vortex</str<strong>on</strong>g> at subsequent times<br />
tω/π = 0, 1, 2, . . . . Top: If h ac is transverse to J, <strong>the</strong> vortices<br />
“walk” in <strong>the</strong> xz plane (<strong>the</strong> vortices are straight since here<br />
J c ≪ h ac , H a is assumed). Bottom: If h ac is parallel to J, <strong>the</strong><br />
vortices periodically tilt in <strong>the</strong> yz plane and at <strong>the</strong> same time<br />
move al<strong>on</strong>g x. From [15]. . . . . . . . . . . . . . . . . . . . . . 8<br />
4 Scheme <str<strong>on</strong>g>of</str<strong>on</strong>g> <strong>the</strong> <str<strong>on</strong>g>vortex</str<strong>on</strong>g> shift in a slab when <strong>the</strong> l<strong>on</strong>gitudinal ac<br />
magnetic field is increased from h ac to h ac + δh. Shown is<br />
<strong>the</strong> projecti<strong>on</strong> <strong>on</strong> <strong>the</strong> xy plane <str<strong>on</strong>g>of</str<strong>on</strong>g> a <str<strong>on</strong>g>vortex</str<strong>on</strong>g> (bold solid line)<br />
which tilts more away from <strong>the</strong> z axis and at <strong>the</strong> same time<br />
shifts from x = x 0 to x = x 0 + δx 0 . The projected shifts <str<strong>on</strong>g>of</str<strong>on</strong>g><br />
some <str<strong>on</strong>g>vortex</str<strong>on</strong>g> line elements are shown as dashed arrows with<br />
comp<strong>on</strong>ents δx 0 and δy(z), δy(z) = −δy(−z). These arrows<br />
are al<strong>on</strong>g <strong>the</strong> Lorentz force, which is perpendicular to <strong>the</strong> local<br />
current density j c (z) (solid arrows) lying in <strong>the</strong> xy planes at<br />
<strong>the</strong> angle φ(z) to <strong>the</strong> y axis. From [15]. . . . . . . . . . . . . . 9<br />
5 Structure <str<strong>on</strong>g>of</str<strong>on</strong>g> YBCO with <strong>the</strong> CuO 2 planes. In NdBCO <strong>the</strong><br />
Yttrium atoms are replaced by Neodymium. . . . . . . . . . . 10<br />
6 Locati<strong>on</strong> <str<strong>on</strong>g>of</str<strong>on</strong>g> <strong>the</strong> melting transiti<strong>on</strong> in <strong>the</strong> magnetic phase diagram.<br />
(Data from specific-heat measurements.) . . . . . . . . 10<br />
7 Sketch <str<strong>on</strong>g>of</str<strong>on</strong>g> <strong>the</strong> experimental setup, side view. . . . . . . . . . . 11<br />
8 Example <str<strong>on</strong>g>of</str<strong>on</strong>g> <strong>the</strong> first unsuccessful measurements at 0 Tesla,<br />
where <strong>the</strong> resistance becomes “negative”. T c is at 96K. . . . . 13<br />
9 Scattered data in <strong>the</strong> graph <str<strong>on</strong>g>of</str<strong>on</strong>g> <strong>the</strong> 9T (2/1000/0.1) measurement. 15<br />
10 Results for <strong>the</strong> measurements <str<strong>on</strong>g>of</str<strong>on</strong>g> <strong>the</strong> resistance <str<strong>on</strong>g>of</str<strong>on</strong>g> NdBCO<br />
without <str<strong>on</strong>g>shaking</str<strong>on</strong>g>. Background and <str<strong>on</strong>g>of</str<strong>on</strong>g>fset distracted. . . . . . . 16<br />
11 Results for <strong>the</strong> measurements at 7T with and without <str<strong>on</strong>g>shaking</str<strong>on</strong>g>.<br />
Upper right: Zoom into <strong>the</strong> regi<strong>on</strong> <str<strong>on</strong>g>of</str<strong>on</strong>g> <strong>the</strong> melting transiti<strong>on</strong>.<br />
Crosses representing <strong>the</strong> run without <str<strong>on</strong>g>shaking</str<strong>on</strong>g>, stars <strong>the</strong> run<br />
with <str<strong>on</strong>g>shaking</str<strong>on</strong>g>. Bottom: Difference between <strong>the</strong> normal and<br />
<strong>the</strong> resistance with <str<strong>on</strong>g>shaking</str<strong>on</strong>g>. . . . . . . . . . . . . . . . . . . . 17<br />
33
12 This figure shows <strong>the</strong> difference between measurements with<br />
and without <str<strong>on</strong>g>shaking</str<strong>on</strong>g> for 9T main field. Obviously, <strong>the</strong> <str<strong>on</strong>g>shaking</str<strong>on</strong>g><br />
did not have an observable effect. . . . . . . . . . . . . . . . . 18<br />
13 The crystal structure <str<strong>on</strong>g>of</str<strong>on</strong>g> LuNi 2 B 2 C. Filled circles are Ni<br />
atoms, <strong>the</strong> largest open circles are Lu atoms. The Ni-B-C<br />
framework is indicated by <strong>the</strong> b<strong>on</strong>ds between <strong>the</strong> atoms. [26] . 20<br />
14 Temperature vs Resistance <str<strong>on</strong>g>of</str<strong>on</strong>g> <strong>the</strong> LuNiBC crystal from 0 to<br />
7T, with <str<strong>on</strong>g>shaking</str<strong>on</strong>g>. . . . . . . . . . . . . . . . . . . . . . . . . . 21<br />
15 Temperature vs Resistance <str<strong>on</strong>g>of</str<strong>on</strong>g> <strong>the</strong> LuNiBC crystal at 2T, with<br />
<str<strong>on</strong>g>shaking</str<strong>on</strong>g>. × represent pre-<str<strong>on</strong>g>shaking</str<strong>on</strong>g> results, + results after <str<strong>on</strong>g>shaking</str<strong>on</strong>g>.<br />
The dotted line follows <strong>the</strong> × as an aid. . . . . . . . . . 22<br />
16 To approach <str<strong>on</strong>g>of</str<strong>on</strong>g> <strong>the</strong> current density J c towards Jc<br />
st is schematically<br />
shown as a functi<strong>on</strong> <str<strong>on</strong>g>of</str<strong>on</strong>g> field B for a fixed Jc st . (i) At point<br />
A, J c > Jc<br />
st and J c decreases when <strong>the</strong> field is increased (path<br />
b) or decreased (path a). Similarly, at point C, J c < Jc<br />
st and<br />
J c increases when <strong>the</strong> field is increased (path d) or decreased<br />
(path c). (ii) The same is shown under <strong>the</strong> applicati<strong>on</strong> <str<strong>on</strong>g>of</str<strong>on</strong>g> an<br />
oscillatory field. [27] . . . . . . . . . . . . . . . . . . . . . . . 23<br />
17 Results for <strong>the</strong> two slow cooling measurements, <strong>the</strong> feature<br />
can be seen at ≈ 9.8K. . . . . . . . . . . . . . . . . . . . . . . 24<br />
18 Results <str<strong>on</strong>g>of</str<strong>on</strong>g> <strong>the</strong> sec<strong>on</strong>d LuNiBC experiments. Adjusted data for<br />
all four runs. . . . . . . . . . . . . . . . . . . . . . . . . . . . . 25<br />
19 Zoom into <strong>the</strong> area around <strong>the</strong> feature. Within <strong>the</strong> experimental<br />
scatter, <strong>the</strong> two features (after fast and slow cooling)<br />
are nearly identical. . . . . . . . . . . . . . . . . . . . . . . . . 26<br />
20 In-plane resistance ρ(H, T) <str<strong>on</strong>g>of</str<strong>on</strong>g> a clean high-temperature superc<strong>on</strong>ductor.<br />
After [28]. . . . . . . . . . . . . . . . . . . . . . . . 29<br />
21 In-plane resistance ρ(H, T) <str<strong>on</strong>g>of</str<strong>on</strong>g> a high-temperature superc<strong>on</strong>ductor<br />
with pinning centers, without <str<strong>on</strong>g>shaking</str<strong>on</strong>g>. . . . . . . . . . 29<br />
22 Sketch <str<strong>on</strong>g>of</str<strong>on</strong>g> <strong>the</strong> experimental setup, top view. . . . . . . . . . . . 30<br />
23 Comparis<strong>on</strong> <str<strong>on</strong>g>of</str<strong>on</strong>g> fast and slow cooling in <strong>the</strong> sec<strong>on</strong>d LuNi 2 B 2 C<br />
experiment. The feature at 9.8K is both times clearly visible. . 31<br />
24 Comparis<strong>on</strong> <str<strong>on</strong>g>of</str<strong>on</strong>g> runs without and with cycling. The upper figure<br />
shows that <strong>the</strong> velocity <str<strong>on</strong>g>of</str<strong>on</strong>g> cooling did not make a difference. 32<br />
34
References<br />
[1] J. Bardeen, L. N. Cooper and J. R. Schriefer: Phys. Rev. 106, 162<br />
(1957); 108, 1175 (1957)<br />
[2] N. W. Ashcr<str<strong>on</strong>g>of</str<strong>on</strong>g>t: Phys. Rev. Lett. 21, 1748 - 1749 (1968)<br />
[3] Quantum Design: PPMS Hardware & Opti<strong>on</strong>s Manuals, 2000<br />
[4] Werner Buckel: Supraleitung, 5. Editi<strong>on</strong>, VCH, 1993<br />
[5] Stefan Menzi: Messung der Richtungsabhängigkeit der spezifischen<br />
Wärme v<strong>on</strong> YBa 2 Cu 3 O 7 : Ein Indikator für s- oder d-Wellen<br />
Supraleitung?, Bachelorarbeit Uni Zürich, 2005<br />
[6] J. G. Bednorz and K. A. Müller: ”Possible high Tc superc<strong>on</strong>ductivity<br />
in <strong>the</strong> BaLaCuO system”. Z. <strong>Physik</strong>, B 64: 189-193.(1986)<br />
[7] A. Abrikosov: On <strong>the</strong> magnetic properties <str<strong>on</strong>g>of</str<strong>on</strong>g> superc<strong>on</strong>ductors <str<strong>on</strong>g>of</str<strong>on</strong>g> sec<strong>on</strong>d<br />
group. Sov. Phys. JETP 5, 1174-1182, (1957).<br />
[8] J. Figueras et al.: Nature 2 402 (2006) www.nature.com/naturephysics<br />
doi:10.1038/nphys311<br />
[9] F. Lindemann: Z.Phys, 11, 609, (1910)<br />
[10] http://phycomp.techni<strong>on</strong>.ac.il/ phsorkin/<strong>the</strong>sis/node4.html<br />
[11] Hugo Keller: Magnetische Flusslinien in Hochtemperatur Supraleitern,<br />
Vierteljahrsschrift der Naturforschenden Gesellschaft in Zürich, 153-160<br />
(4) (2000)<br />
[12] A. T. Fiory and B. Serin: Phys. Lett.25A, 557 (1967)<br />
[13] M. Willemin, C. Rossel, J. H<str<strong>on</strong>g>of</str<strong>on</strong>g>er, H. Keller, A. Erb, and E. Walker:<br />
Phys. Rev. B 58, R5940 (1998)<br />
[14] Brandt, P. Esquinazi and H. Neckel: J. Low Temp. Phys. 63, 187 (1986)<br />
[15] G. P. Mikitik and E. H. Brandt: J. Low Temp. Phys. 139, 221 (2005)<br />
[16] E. H. Brandt and G. P. Mikitik: Phys. Rev. Lett. 89 027002-1 (2002)<br />
[17] Andrei Mourachkine: Room-Temperature Superc<strong>on</strong>ductivity, Cambridge<br />
Intenati<strong>on</strong>al Science Publishing (2004)<br />
35
[18] K. Yamafuji, N. Sakamoto, and T. Kawashima: Phys. Lett. 36A, 341<br />
(1971)<br />
[19] C.P. Bean: Phys. Rev. Lett. 8, 250 (1962); Rev. Mod. Phys. 36, 31<br />
(1964).<br />
[20] A. Schilling et al.: Nature 382 791 (1996)<br />
[21] U. Welp et al.: Phys. Rev. Lett. 76 4809 (1995)<br />
[22] G. W. Crabtree et al.: Journal <str<strong>on</strong>g>of</str<strong>on</strong>g> Low Temperature Physics (1996)<br />
[23] M. Willemin et al.: Phys. Rev. Lett. 81, 4236 (1998)<br />
[24] S. Samarappuli, A. Schilling and H. R. Ott: Physica C, Volume 201,<br />
Issue 1-2, p. 159-165. (1992)<br />
[25] G. P. Mikitik and E. H. Brandt: Journal <str<strong>on</strong>g>of</str<strong>on</strong>g> Low Temperature Physics,<br />
139 (2005)<br />
[26] T. Siegrist et al.: Nature 367, 254-256 Letter (1994)<br />
[27] G. Ravikumari et al.: Phys. Rev. B 63, 024505 (2000)<br />
[28] A. K. Pradhan, S. Shibata, K. Nakao and N. Koshizuka: Europhys. Lett,<br />
46 (6), 787-793 (1999)<br />
36