The vulnerability of ecosystem services to land use change
The vulnerability of ecosystem services to land use change
The vulnerability of ecosystem services to land use change

You also want an ePaper? Increase the reach of your titles
YUMPU automatically turns print PDFs into web optimized ePapers that Google loves.
80<br />
M.J. Metzger et al. / Agriculture, Ecosystems and Environment 114 (2006) 69–85<br />
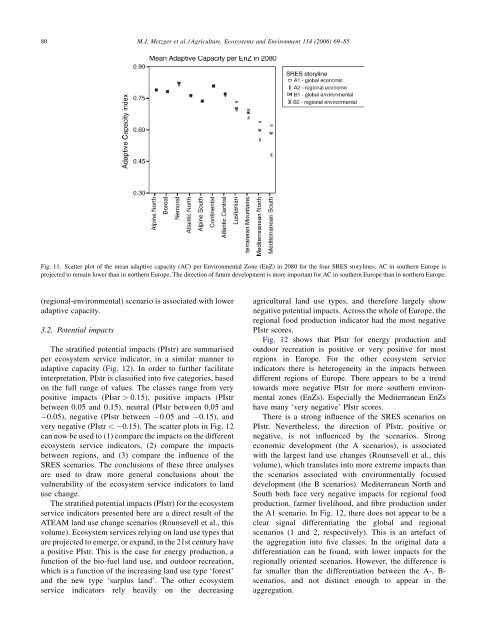
Fig. 11. Scatter plot <strong>of</strong> the mean adaptive capacity (AC) per Environmental Zone (EnZ) in 2080 for the four SRES s<strong>to</strong>rylines. AC in southern Europe is<br />
projected <strong>to</strong> remain lower than in northern Europe. <strong>The</strong> direction <strong>of</strong> future development is more important for AC in southern Europe than in northern Europe.<br />
(regional-environmental) scenario is associated with lower<br />
adaptive capacity.<br />
3.2. Potential impacts<br />
<strong>The</strong> stratified potential impacts (PIstr) are summarised<br />
per <strong>ecosystem</strong> service indica<strong>to</strong>r, in a similar manner <strong>to</strong><br />
adaptive capacity (Fig. 12). In order <strong>to</strong> further facilitate<br />
interpretation, PIstr is classified in<strong>to</strong> five categories, based<br />
on the full range <strong>of</strong> values. <strong>The</strong> classes range from very<br />
positive impacts (PIstr > 0.15), positive impacts (PIstr<br />
between 0.05 and 0.15), neutral (PIstr between 0.05 and<br />
0.05), negative (PIstr between 0.05 and 0.15), and<br />
very negative (PIstr < 0.15). <strong>The</strong> scatter plots in Fig. 12<br />
can now be <strong>use</strong>d <strong>to</strong> (1) compare the impacts on the different<br />
<strong>ecosystem</strong> service indica<strong>to</strong>rs, (2) compare the impacts<br />
between regions, and (3) compare the influence <strong>of</strong> the<br />
SRES scenarios. <strong>The</strong> conclusions <strong>of</strong> these three analyses<br />
are <strong>use</strong>d <strong>to</strong> draw more general conclusions about the<br />
<strong>vulnerability</strong> <strong>of</strong> the <strong>ecosystem</strong> service indica<strong>to</strong>rs <strong>to</strong> <strong>land</strong><br />
<strong>use</strong> <strong>change</strong>.<br />
<strong>The</strong> stratified potential impacts (PIstr) for the <strong>ecosystem</strong><br />
service indica<strong>to</strong>rs presented here are a direct result <strong>of</strong> the<br />
ATEAM <strong>land</strong> <strong>use</strong> <strong>change</strong> scenarios (Rounsevell et al., this<br />
volume). Ecosystem <strong>services</strong> relying on <strong>land</strong> <strong>use</strong> types that<br />
are projected <strong>to</strong> emerge, or expand, in the 21st century have<br />
a positive PIstr. This is the case for energy production, a<br />
function <strong>of</strong> the bio-fuel <strong>land</strong> <strong>use</strong>, and outdoor recreation,<br />
which is a function <strong>of</strong> the increasing <strong>land</strong> <strong>use</strong> type ‘forest’<br />
and the new type ‘surplus <strong>land</strong>’. <strong>The</strong> other <strong>ecosystem</strong><br />
service indica<strong>to</strong>rs rely heavily on the decreasing<br />
agricultural <strong>land</strong> <strong>use</strong> types, and therefore largely show<br />
negative potential impacts. Across the whole <strong>of</strong> Europe, the<br />
regional food production indica<strong>to</strong>r had the most negative<br />
PIstr scores.<br />
Fig. 12 shows that PIstr for energy production and<br />
outdoor recreation is positive or very positive for most<br />
regions in Europe. For the other <strong>ecosystem</strong> service<br />
indica<strong>to</strong>rs there is heterogeneity in the impacts between<br />
different regions <strong>of</strong> Europe. <strong>The</strong>re appears <strong>to</strong> be a trend<br />
<strong>to</strong>wards more negative PIstr for more southern environmental<br />
zones (EnZs). Especially the Mediterranean EnZs<br />
have many ‘very negative’ PIstr scores.<br />
<strong>The</strong>re is a strong influence <strong>of</strong> the SRES scenarios on<br />
PIstr. Nevertheless, the direction <strong>of</strong> PIstr, positive or<br />
negative, is not influenced by the scenarios. Strong<br />
economic development (the A scenarios), is associated<br />
with the largest <strong>land</strong> <strong>use</strong> <strong>change</strong>s (Rounsevell et al., this<br />
volume), which translates in<strong>to</strong> more extreme impacts than<br />
the scenarios associated with environmentally foc<strong>use</strong>d<br />
development (the B scenarios). Mediterranean North and<br />
South both face very negative impacts for regional food<br />
production, farmer livelihood, and fibre production under<br />
the A1 scenario. In Fig. 12, there does not appear <strong>to</strong> be a<br />
clear signal differentiating the global and regional<br />
scenarios (1 and 2, respectively). This is an artefact <strong>of</strong><br />
the aggregation in<strong>to</strong> five classes. In the original data a<br />
differentiation can be found, with lower impacts for the<br />
regionally oriented scenarios. However, the difference is<br />
far smaller than the differentiation between the A-, B-<br />
scenarios, and not distinct enough <strong>to</strong> appear in the<br />
aggregation.