The vulnerability of ecosystem services to land use change
The vulnerability of ecosystem services to land use change
The vulnerability of ecosystem services to land use change

You also want an ePaper? Increase the reach of your titles
YUMPU automatically turns print PDFs into web optimized ePapers that Google loves.
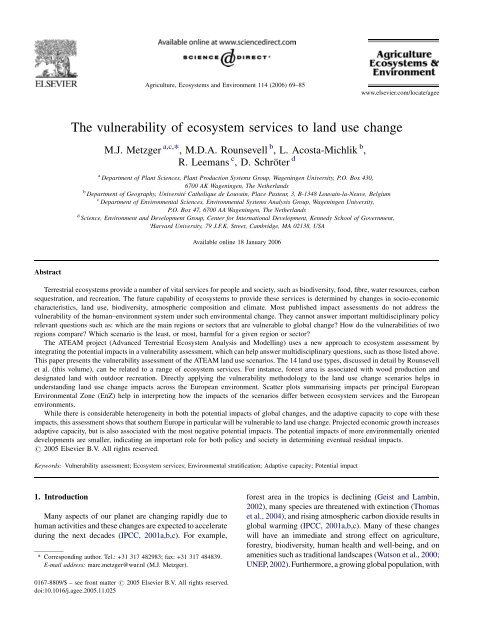
Agriculture, Ecosystems and Environment 114 (2006) 69–85<br />
www.elsevier.com/locate/agee<br />
<strong>The</strong> <strong>vulnerability</strong> <strong>of</strong> <strong>ecosystem</strong> <strong>services</strong> <strong>to</strong> <strong>land</strong> <strong>use</strong> <strong>change</strong><br />
M.J. Metzger a,c, *, M.D.A. Rounsevell b , L. Acosta-Michlik b ,<br />
R. Leemans c , D. Schröter d<br />
a Department <strong>of</strong> Plant Sciences, Plant Production Systems Group, Wageningen University, P.O. Box 430,<br />
6700 AK Wageningen, <strong>The</strong> Nether<strong>land</strong>s<br />
b Department <strong>of</strong> Geography, Université Catholique de Louvain, Place Pasteur, 3, B-1348 Louvain-la-Neuve, Belgium<br />
c Department <strong>of</strong> Environmental Sciences, Environmental Systems Analysis Group, Wageningen University,<br />
P.O. Box 47, 6700 AA Wageningen, <strong>The</strong> Nether<strong>land</strong>s<br />
d Science, Environment and Development Group, Center for International Development, Kennedy School <strong>of</strong> Government,<br />
‘Harvard University, 79 J.F.K. Street, Cambridge, MA 02138, USA<br />
Available online 18 January 2006<br />
Abstract<br />
Terrestrial <strong>ecosystem</strong>s provide a number <strong>of</strong> vital <strong>services</strong> for people and society, such as biodiversity, food, fibre, water resources, carbon<br />
sequestration, and recreation. <strong>The</strong> future capability <strong>of</strong> <strong>ecosystem</strong>s <strong>to</strong> provide these <strong>services</strong> is determined by <strong>change</strong>s in socio-economic<br />
characteristics, <strong>land</strong> <strong>use</strong>, biodiversity, atmospheric composition and climate. Most published impact assessments do not address the<br />
<strong>vulnerability</strong> <strong>of</strong> the human–environment system under such environmental <strong>change</strong>. <strong>The</strong>y cannot answer important multidisciplinary policy<br />
relevant questions such as: which are the main regions or sec<strong>to</strong>rs that are vulnerable <strong>to</strong> global <strong>change</strong>? How do the vulnerabilities <strong>of</strong> two<br />
regions compare? Which scenario is the least, or most, harmful for a given region or sec<strong>to</strong>r?<br />
<strong>The</strong> ATEAM project (Advanced Terrestrial Ecosystem Analysis and Modelling) <strong>use</strong>s a new approach <strong>to</strong> <strong>ecosystem</strong> assessment by<br />
integrating the potential impacts in a <strong>vulnerability</strong> assessment, which can help answer multidisciplinary questions, such as those listed above.<br />
This paper presents the <strong>vulnerability</strong> assessment <strong>of</strong> the ATEAM <strong>land</strong> <strong>use</strong> scenarios. <strong>The</strong> 14 <strong>land</strong> <strong>use</strong> types, discussed in detail by Rounsevell<br />
et al. (this volume), can be related <strong>to</strong> a range <strong>of</strong> <strong>ecosystem</strong> <strong>services</strong>. For instance, forest area is associated with wood production and<br />
designated <strong>land</strong> with outdoor recreation. Directly applying the <strong>vulnerability</strong> methodology <strong>to</strong> the <strong>land</strong> <strong>use</strong> <strong>change</strong> scenarios helps in<br />
understanding <strong>land</strong> <strong>use</strong> <strong>change</strong> impacts across the European environment. Scatter plots summarising impacts per principal European<br />
Environmental Zone (EnZ) help in interpreting how the impacts <strong>of</strong> the scenarios differ between <strong>ecosystem</strong> <strong>services</strong> and the European<br />
environments.<br />
While there is considerable heterogeneity in both the potential impacts <strong>of</strong> global <strong>change</strong>s, and the adaptive capacity <strong>to</strong> cope with these<br />
impacts, this assessment shows that southern Europe in particular will be vulnerable <strong>to</strong> <strong>land</strong> <strong>use</strong> <strong>change</strong>. Projected economic growth increases<br />
adaptive capacity, but is also associated with the most negative potential impacts. <strong>The</strong> potential impacts <strong>of</strong> more environmentally oriented<br />
developments are smaller, indicating an important role for both policy and society in determining eventual residual impacts.<br />
# 2005 Elsevier B.V. All rights reserved.<br />
Keywords: Vulnerability assessment; Ecosystem <strong>services</strong>; Environmental stratification; Adaptive capacity; Potential impact<br />
1. Introduction<br />
Many aspects <strong>of</strong> our planet are changing rapidly due <strong>to</strong><br />
human activities and these <strong>change</strong>s are expected <strong>to</strong> accelerate<br />
during the next decades (IPCC, 2001a,b,c). For example,<br />
* Corresponding author. Tel.: +31 317 482983; fax: +31 317 484839.<br />
E-mail address: marc.metzger@wur.nl (M.J. Metzger).<br />
forest area in the tropics is declining (Geist and Lambin,<br />
2002), many species are threatened with extinction (Thomas<br />
et al., 2004), and rising atmospheric carbon dioxide results in<br />
global warming (IPCC, 2001a,b,c). Many <strong>of</strong> these <strong>change</strong>s<br />
will have an immediate and strong effect on agriculture,<br />
forestry, biodiversity, human health and well-being, and on<br />
amenities such as traditional <strong>land</strong>scapes (Watson et al., 2000;<br />
UNEP, 2002). Furthermore, a growing global population, with<br />
0167-8809/$ – see front matter # 2005 Elsevier B.V. All rights reserved.<br />
doi:10.1016/j.agee.2005.11.025
70<br />
M.J. Metzger et al. / Agriculture, Ecosystems and Environment 114 (2006) 69–85<br />
increasing per capita consumption <strong>of</strong> food and energy, are<br />
expected <strong>to</strong> continue emitting pollutants <strong>to</strong> the atmosphere,<br />
resulting in continued nitrogen deposition and eutrophication<br />
<strong>of</strong> environments (Galloway, 2001; Alcamo, 2002). In the face<br />
<strong>of</strong> these <strong>change</strong>s, it is important <strong>to</strong> integrate and extend current<br />
operational systems for moni<strong>to</strong>ring and reporting on<br />
environmental and social conditions (cf. Kates et al.,<br />
2001). Over the last decades many people have become<br />
increasingly aware <strong>of</strong> these environmental <strong>change</strong>s, such that<br />
they are now commonly recognised as ‘global <strong>change</strong>’<br />
(Steffen et al., 2001). Many research projects and several<br />
environmental assessments are currently addressing these<br />
concerns at all relevant scales, frequently in multidisciplinary<br />
collaborations. However, integrating this wealth <strong>of</strong> information<br />
across disciplines remains a considerable challenge<br />
(Millenium Ecosystem Assessment, 2003).<br />
This paper aims <strong>to</strong> quantify global-<strong>change</strong> concerns,<br />
focusing specifically on <strong>change</strong>s associated with scenarios<br />
<strong>of</strong> <strong>land</strong> <strong>use</strong> <strong>change</strong>, by defining and estimating vulnerabilities.<br />
Both the <strong>vulnerability</strong> concept (Metzger et al.,<br />
2004; Metzger, 2005) and the <strong>land</strong> <strong>use</strong> <strong>change</strong> scenarios<br />
(Rounsevell et al., 2005; Ewert et al., 2005; Kankaanpaa and<br />
Carter, 2004; Rounsevell et al., this volume) described in this<br />
paper were developed as part <strong>of</strong> the ATEAM project<br />
(Advanced Terrestrial Ecosystem Analysis and Modelling).<br />
Detailed information about the project can be found on its<br />
website (http://www.pik-potsdam.de/ateam).<br />
Amongst the many aspects <strong>of</strong> global <strong>change</strong>, <strong>land</strong> <strong>use</strong><br />
<strong>change</strong> has been highlighted as a key human-induced affect<br />
on <strong>ecosystem</strong>s (Turner et al., 1997; Lambin et al., 2001).<br />
Land <strong>use</strong> has been changing since people first began <strong>to</strong><br />
manage their environment, but the <strong>change</strong>s in Europe over<br />
the past 50 years have been especially important. An<br />
increasingly urbanised society has led <strong>to</strong> the major<br />
development <strong>of</strong> settlements, improved technology <strong>to</strong> a<br />
changing role for agriculture and new aspirations have lead<br />
<strong>to</strong> <strong>land</strong> being <strong>use</strong>d for recreation and leisure. Such <strong>land</strong> <strong>use</strong><br />
<strong>change</strong> directly influences the provision <strong>ecosystem</strong> <strong>services</strong><br />
(e.g. provision <strong>of</strong> food and timber, climate regulation,<br />
nutrient cycling, and cultural identity) (Daily, 1997;<br />
Millenium Ecosystem Assessment, 2003; Reid et al.,<br />
2005). In the <strong>vulnerability</strong> concept <strong>use</strong>d in this paper, the<br />
sustainable supply <strong>of</strong> <strong>ecosystem</strong> <strong>services</strong> is <strong>use</strong>d as a<br />
measure <strong>of</strong> human well-being under the influence <strong>of</strong> global<br />
<strong>change</strong> threats, as indicated by the Millenium Ecosystem<br />
Assessment (2003). This is similar <strong>to</strong> the approach <strong>use</strong>d by<br />
Luers et al. (2003) in looking at the <strong>vulnerability</strong> <strong>of</strong> Mexican<br />
farmers <strong>to</strong> decreasing wheat yields arising from climate<br />
damage and market fluctuations.<br />
<strong>The</strong> Synthesis chapter (Smith et al., 2001) <strong>of</strong> the<br />
Intergovernmental Panel on Climate Change (IPCC) Third<br />
Assessment Report (TAR) recognised the limitations <strong>of</strong><br />
traditional impact assessments, where a few climate-<strong>change</strong><br />
scenarios are <strong>use</strong>d <strong>to</strong> assess the response <strong>of</strong> a system at a<br />
future time. Smith et al. (2001) challenged the scientific<br />
community <strong>to</strong> move <strong>to</strong>ward more transient assessments that<br />
are a function <strong>of</strong> shifting environmental parameters<br />
(including climate) and socio-economic trends, and explicitly<br />
include the ability <strong>to</strong> innovate and adapt <strong>to</strong> the resulting<br />
<strong>change</strong>s. A step <strong>to</strong>wards meeting this challenge is their<br />
definition <strong>of</strong> ‘‘<strong>vulnerability</strong>’’:<br />
Vulnerability is the degree <strong>to</strong> which a system is susceptible<br />
<strong>to</strong>, or unable <strong>to</strong> cope with, adverse effects <strong>of</strong> climate <strong>change</strong>,<br />
including climate variability and extremes (IPCC TAR).<br />
Although this definition addresses climate <strong>change</strong> only, it<br />
already includes susceptibility, which is a function <strong>of</strong><br />
exposure, sensitivity, and adaptive capacity. <strong>The</strong> <strong>vulnerability</strong><br />
concept developed for ATEAM is a further<br />
elaboration <strong>of</strong> this definition and was developed especially<br />
<strong>to</strong> integrate results from a broad range <strong>of</strong> models and<br />
scenarios. Projections <strong>of</strong> changing supply <strong>of</strong> different<br />
<strong>ecosystem</strong> <strong>services</strong> and scenario-based <strong>change</strong>s in adaptive<br />
capacity are integrated in<strong>to</strong> <strong>vulnerability</strong> maps for different<br />
socio-economic sec<strong>to</strong>rs (agriculture, forestry, water management,<br />
energy, and nature conservation) (Schröter et al.,<br />
2005a; Metzger et al., 2004). <strong>The</strong>se <strong>vulnerability</strong> maps<br />
provide a means <strong>of</strong> making comparisons between <strong>ecosystem</strong><br />
<strong>services</strong>, sec<strong>to</strong>rs, scenarios and regions <strong>to</strong> tackle questions<br />
such as:<br />
Which regions are most vulnerable <strong>to</strong> global <strong>change</strong>?<br />
How do the vulnerabilities <strong>of</strong> two regions compare?<br />
Which sec<strong>to</strong>rs are the most vulnerable in a certain region?<br />
Which scenario is the least harmful for a sec<strong>to</strong>r?<br />
<strong>The</strong> term <strong>vulnerability</strong> was thus defined in such a way <strong>to</strong><br />
include both the traditional elements <strong>of</strong> an impact<br />
assessment (i.e. potential impacts <strong>of</strong> a system <strong>to</strong> exposures),<br />
and adaptive capacity <strong>to</strong> cope with the potential impacts <strong>of</strong><br />
global <strong>change</strong> (Turner et al., 2003; Schröter et al., 2005b).<br />
<strong>The</strong> following sections first summarise the concepts <strong>of</strong><br />
the spatially explicit and quantitative framework that was<br />
developed for a <strong>vulnerability</strong> assessment for Europe. It is<br />
explained how various <strong>land</strong> <strong>use</strong> <strong>change</strong>s were coupled <strong>to</strong><br />
<strong>change</strong>s in <strong>ecosystem</strong> service provision, and the findings are<br />
discussed per principal European Environmental Zone.<br />
2. Methods<br />
<strong>The</strong> terminology developed by the IPCC forms a suitable<br />
starting point for explaining the different elements <strong>of</strong> the<br />
<strong>vulnerability</strong> assessment presented here. This section first<br />
defines and explains the various elements <strong>of</strong> the <strong>vulnerability</strong><br />
concept, including exposure, potential impacts and<br />
adaptive capacity, and how these elements are combined <strong>to</strong><br />
form <strong>vulnerability</strong> maps. <strong>The</strong>n the derivation <strong>of</strong> five<br />
<strong>ecosystem</strong> service indica<strong>to</strong>rs from the ATEAM <strong>land</strong> <strong>use</strong><br />
scenarios (Rounsevell et al., this volume) is explained.<br />
Finally, the <strong>vulnerability</strong> assessment <strong>of</strong> these scenarios is<br />
presented, based on <strong>ecosystem</strong> service indica<strong>to</strong>rs.
M.J. Metzger et al. / Agriculture, Ecosystems and Environment 114 (2006) 69–85 71<br />
2.1. <strong>The</strong> concept <strong>of</strong> <strong>vulnerability</strong><br />
As a starting point for the ATEAM <strong>vulnerability</strong> concept,<br />
the IPCC definitions <strong>of</strong> <strong>vulnerability</strong> <strong>to</strong> climate <strong>change</strong>, and<br />
related terms such as exposure, sensitivity, and adaptive<br />
capacity, were broadened in order <strong>to</strong> consider not only<br />
climate <strong>change</strong>, but also other global <strong>change</strong>s such as <strong>land</strong><br />
<strong>use</strong> <strong>change</strong> (Schröter et al., 2005a). Table 1 lists the<br />
definitions <strong>of</strong> some fundamental terms <strong>use</strong>d in this paper and<br />
gives an example <strong>of</strong> how these terms could relate <strong>to</strong> the<br />
agriculture sec<strong>to</strong>r. From these definitions the following<br />
generic functions are constructed, describing the <strong>vulnerability</strong><br />
<strong>of</strong> a sec<strong>to</strong>r relying on a particular <strong>ecosystem</strong> service<br />
at a particular location (e.g. grid cell) under a certain<br />
scenario and at a certain point in time. Vulnerability is a<br />
function <strong>of</strong> exposure, sensitivity and adaptive capacity<br />
(Eq. (1)). Potential impacts are a function <strong>of</strong> exposure and<br />
sensitivity (Eq. (2)). <strong>The</strong>refore, <strong>vulnerability</strong> is a function <strong>of</strong><br />
potential impacts and adaptive capacity (Eq. (3)):<br />
Vðes; x; s; tÞ ¼ f ðEðes; x; s; tÞ; Sðes; x; s; tÞ; ACðes; x; s; tÞÞ<br />
(1)<br />
PIðes; x; s; tÞ ¼ f ðEðes; x; s; tÞ; Sðes; x; s; tÞÞ (2)<br />
Vðes; x; s; tÞ ¼ f ðPIðes; x; s; tÞ; ACðes; x; s; tÞÞ (3)<br />
where V is the <strong>vulnerability</strong>, E the exposure, S the sensitivity,<br />
AC the adaptive capacity, PI the potential impact, es the<br />
<strong>ecosystem</strong> service, x the grid cell, s the scenario, and t is a<br />
time slice.<br />
<strong>The</strong>se simple conceptual functions describe how the<br />
different elements <strong>of</strong> <strong>vulnerability</strong> are related <strong>to</strong> each other.<br />
Nevertheless, they are not immediately operational for<br />
converting maps <strong>of</strong> <strong>ecosystem</strong> <strong>services</strong> in<strong>to</strong> <strong>vulnerability</strong><br />
maps. <strong>The</strong> following sections illustrate how <strong>vulnerability</strong> is<br />
quantified and mapped in the present study, using one<br />
<strong>ecosystem</strong> service indica<strong>to</strong>r, farmer livelihood, as an example.<br />
2.2. Exposure, sensitivity and potential impacts<br />
<strong>The</strong> IPCC projections <strong>of</strong> the main global <strong>change</strong> drivers,<br />
based on the Special Report on Emissions Scenarios (SRES)<br />
(Nakicenovic et al., 2000) were <strong>use</strong>d <strong>to</strong> represent exposure.<br />
SRES consists <strong>of</strong> a comprehensive set <strong>of</strong> narratives that<br />
define the local, regional and global socio-economic driving<br />
forces <strong>of</strong> environmental <strong>change</strong> (e.g. demography, economy,<br />
technology, energy, and agriculture). <strong>The</strong> SRES s<strong>to</strong>rylines<br />
were structured in four major ‘families’ labelled A1, A2, B1,<br />
and B2, each <strong>of</strong> which emphasises a largely different set <strong>of</strong><br />
social and economic development pathways, organised<br />
along two axes. <strong>The</strong> vertical axis represents a distinction<br />
between more economically (A) and more environmentally<br />
and equity (B) orientated futures. <strong>The</strong> horizontal axis<br />
represents the range between more globalisation (1) and<br />
more regionally oriented developments (2). Rounsevell et al.<br />
(this volume) give a summary <strong>of</strong> the main trends in the<br />
ATEAM <strong>land</strong> <strong>use</strong> scenarios.<br />
Table 1<br />
Definitions <strong>of</strong> important terminology related <strong>to</strong> <strong>vulnerability</strong>, with an example for the agriculture sec<strong>to</strong>r<br />
Term ATEAM definitions based on IPCC TAR Part <strong>of</strong> the assessment Agriculture example<br />
Exposure (E)<br />
Sensitivity (S)<br />
Adaptation (A)<br />
Potential impact (PI)<br />
Adaptive capacity (AC)<br />
Vulnerability (V)<br />
Planned adaptation (PA)<br />
Residual impact (RI)<br />
<strong>The</strong> nature and degree <strong>to</strong> which <strong>ecosystem</strong>s<br />
are exposed <strong>to</strong> environmental <strong>change</strong><br />
<strong>The</strong> degree <strong>to</strong> which a human-environment<br />
system is affected, either adversely or beneficially,<br />
by environmental <strong>change</strong><br />
Adjustment in natural or human systems<br />
<strong>to</strong> a new or changing environment<br />
All impacts that may occur given projected<br />
environmental <strong>change</strong>, without considering<br />
planned adaptation<br />
<strong>The</strong> potential <strong>to</strong> implement planned<br />
adaptation measures<br />
<strong>The</strong> degree <strong>to</strong> which an <strong>ecosystem</strong> service is<br />
sensitive <strong>to</strong> global <strong>change</strong> plus the degree <strong>to</strong><br />
which the sec<strong>to</strong>r that relies on this service is<br />
unable <strong>to</strong> adapt <strong>to</strong> the <strong>change</strong>s<br />
<strong>The</strong> result <strong>of</strong> a deliberate policy decision based<br />
on an awareness that conditions have <strong>change</strong>d<br />
or are about <strong>to</strong> <strong>change</strong> and that action is required<br />
<strong>to</strong> return <strong>to</strong>, maintain or achieve a desired state<br />
<strong>The</strong> impacts <strong>of</strong> global <strong>change</strong> that would occur<br />
after considering planned adaptation<br />
Scenarios<br />
Ecosystem models or in this<br />
study: <strong>land</strong> <strong>use</strong> scenarios<br />
Ecosystem models or in this<br />
study: <strong>land</strong> <strong>use</strong> scenarios<br />
Ecosystem models or in this<br />
study: <strong>land</strong> <strong>use</strong> scenarios<br />
Vulnerability assessment<br />
Vulnerability assessment<br />
<strong>The</strong> future will tell<br />
<strong>The</strong> future will tell<br />
IPCC TAR: Intergovernmental Panel on Climate Change Third Assessment Report (IPCC, 2001b).<br />
Land abandonment, increased climatic<br />
stress, decreases in demand<br />
Agricultural <strong>ecosystem</strong>s, communities<br />
and <strong>land</strong>scapes are affected by<br />
environmental <strong>change</strong><br />
Changes in local management, <strong>change</strong> crop<br />
Decrease in agricultural <strong>land</strong><br />
Capacity <strong>to</strong> implement better<br />
agricultural management and technologies<br />
Increased probability <strong>of</strong> production losses<br />
through losses <strong>of</strong> agricultural area combined<br />
with inability <strong>to</strong> switch <strong>to</strong> save cash and<br />
quality crops<br />
Better agricultural management and<br />
technologies<br />
Land abandonment, intensification
72<br />
M.J. Metzger et al. / Agriculture, Ecosystems and Environment 114 (2006) 69–85<br />
Fig. 1. Ecosystem service supply indica<strong>to</strong>r for ‘farmer livelihood’, as modelled by the ATEAM <strong>land</strong> <strong>use</strong> scenarios for baseline conditions and the A1 scenario<br />
for the 2080 time slice.<br />
Scenarios were developed for atmospheric carbon<br />
dioxide concentration, climate (Mitchell et al., 2004),<br />
socio-economic variables, and <strong>land</strong> <strong>use</strong> (Rounsevell et al.,<br />
this volume). <strong>The</strong>se scenarios are internally consistent, and<br />
considered explicitly the global context <strong>of</strong> European <strong>land</strong><br />
<strong>use</strong> (i.e. import and export <strong>of</strong> agricultural goods). <strong>The</strong><br />
IMAGE implementation (IMAGE Team, 2001) <strong>of</strong> these<br />
scenarios was <strong>use</strong>d <strong>to</strong> define the global context (trade, socioeconomic<br />
trends, demography, global emissions, and<br />
atmospheric concentrations, climate <strong>change</strong> levels). <strong>The</strong><br />
high-resolution (10 0 10 0 , approximately 16 km 16 km<br />
in Europe) <strong>land</strong> <strong>use</strong> <strong>change</strong> scenarios <strong>use</strong>d in this<br />
<strong>vulnerability</strong> assessment were derived from an interpretation<br />
<strong>of</strong> the SRES s<strong>to</strong>rylines. <strong>The</strong> <strong>vulnerability</strong> assessment spans a<br />
wide range <strong>of</strong> plausible futures for three time slices (1990–<br />
2020, 2020–2050, 2050–2080).<br />
In ATEAM, <strong>ecosystem</strong> service provision was estimated<br />
by <strong>ecosystem</strong> models as a function <strong>of</strong> <strong>ecosystem</strong> sensitivity<br />
and global <strong>change</strong> exposure. In this manuscript <strong>ecosystem</strong><br />
service provision was directly linked <strong>to</strong> the <strong>land</strong> <strong>use</strong><br />
scenarios, as discussed in Section 2.6. <strong>The</strong> resulting range <strong>of</strong><br />
outputs for each <strong>ecosystem</strong> service indica<strong>to</strong>r enabled the<br />
differentiation <strong>of</strong> regions that are impacted under most<br />
scenarios, regions that are impacted under specific scenarios,<br />
and regions that are not impacted under any scenario.<br />
<strong>The</strong> example maps in this manuscript are restricted <strong>to</strong> the<br />
<strong>ecosystem</strong> service indica<strong>to</strong>r ‘farmer livelihood’ (Fig. 1). For<br />
this <strong>ecosystem</strong> service indica<strong>to</strong>r, the <strong>vulnerability</strong> approach<br />
is illustrated with maps for one scenario, the A1 1 scenario,<br />
which assumes continued globalisation with a focus on<br />
economic growth. In Section 2.7 the analysis <strong>of</strong> multiple<br />
scenarios is discussed.<br />
1 In SRES, the A1 s<strong>to</strong>ryline was split in three (fi: fossil intensive; b: a<br />
mixed set and t: only renewables) <strong>to</strong> illustrate differences in emissions<br />
ca<strong>use</strong>d by different combinations <strong>of</strong> energy carriers. For the present analysis<br />
only A1fi, resulting in the highest emissions, was <strong>use</strong>d. In the present paper<br />
A1 therefore refers <strong>to</strong> A1fi.<br />
2.3. Stratified potential impacts<br />
<strong>The</strong> estimation <strong>of</strong> potential impacts is undertaken at the<br />
regional scale, emphasising the differences across the<br />
European environment. Simply comparing <strong>change</strong>s in<br />
<strong>ecosystem</strong> <strong>services</strong> across Europe provides only a limited<br />
analysis <strong>of</strong> regional differences beca<strong>use</strong> <strong>ecosystem</strong> <strong>services</strong><br />
are highly correlated with their environments. Some<br />
environments have high values for particular <strong>ecosystem</strong><br />
<strong>services</strong>, whereas other regions have lower values. For<br />
instance, Spain has high biodiversity (5048 vascular plant<br />
species (WCMC, 1992)), but low grain yields (2.7 t ha 1 for<br />
1998–2000 average (Ekboir, 2002)), whereas <strong>The</strong> Nether<strong>land</strong>s<br />
has a far lower biodiversity (1477 vascular plant species<br />
(van der Meijden et al., 1996)), but a very high grain yield<br />
(8.1 t ha 1 for 1998–2000 average (Ekboir, 2002)). While<br />
human decisions influence regional <strong>land</strong> <strong>use</strong> more directly<br />
than broad environmental conditions, at a European scale <strong>land</strong><br />
<strong>use</strong> is in part a function <strong>of</strong> environment (Thuiller et al., 2004;<br />
Metzger et al., 2005a). This is illustrated in Fig. 2, where<br />
agricultural <strong>land</strong> <strong>use</strong>, derived from Eurostat NewCronos<br />
agricultural statistics, is summarised for four Environmental<br />
Zones (see Fig. 3, 1990). Agriculture is almost absent in<br />
Alpine North. Grass<strong>land</strong>s and arable <strong>land</strong> dominate the<br />
Atlantic regions, with more grass<strong>land</strong> than arable <strong>land</strong> in<br />
Atlantic North and vice versa in Atlantic Central. Permanent<br />
crops cover 39% <strong>of</strong> Mediterranean South. Beca<strong>use</strong> <strong>of</strong> the<br />
relation between broad environment and <strong>land</strong> <strong>use</strong>, absolute<br />
differences in <strong>land</strong> <strong>use</strong> percentages are not good measures for<br />
comparing regional impacts between different European<br />
environments. Looking at relative <strong>change</strong>s would overcome<br />
this problem (e.g. 40% arable <strong>land</strong> in Mediterranean south<br />
versus +8% in the Boreal), but also has a serious limitation:<br />
the same relative <strong>change</strong> can occur invery different situations.<br />
Table 2 illustrates how a relative <strong>change</strong> <strong>of</strong> 20% can<br />
represent very different impacts, both between and within<br />
environments. <strong>The</strong>refore comparisons <strong>of</strong> relative <strong>change</strong>s in<br />
single grid cells must be interpreted with great care.
M.J. Metzger et al. / Agriculture, Ecosystems and Environment 114 (2006) 69–85 73<br />
Fig. 2. Proportions <strong>of</strong> agricultural <strong>land</strong> <strong>use</strong>s in four Environmental Zones (Metzger et al., 2005a) based on Eurostat NewCronos agricultural statistics.<br />
Fig. 3. Environmental Stratification <strong>of</strong> Europe (EnS), in 84 strata, here aggregated <strong>to</strong> environmental zones for presentation purposes.<br />
For a meaningful comparison <strong>of</strong> grid cells across Europe<br />
it is necessary <strong>to</strong> place potential impacts in their regional<br />
environmental context, i.e. in an environmental envelope, or<br />
stratum, that is suited as a reference for the values in an<br />
individual grid cell. Beca<strong>use</strong> environments will alter under<br />
global <strong>change</strong>, consistent environmental strata must be<br />
determined for each time slice. We <strong>use</strong>d the recently<br />
developed Environmental Stratification <strong>of</strong> Europe (EnS) <strong>to</strong><br />
stratify the modelled potential impacts (Metzger et al.,<br />
2005a). <strong>The</strong> EnS was created by statistical clustering <strong>of</strong><br />
selected climate and <strong>to</strong>pographical variables in<strong>to</strong> 84 strata.<br />
For each stratum a discriminant function was calculated for<br />
the variables available from the climate <strong>change</strong> scenarios.<br />
With these functions the 84 climate classes were mapped for<br />
the different GCMs, scenarios and time slices, resulting in<br />
48 maps <strong>of</strong> shifted climate classes (Metzger, 2005). Maps <strong>of</strong><br />
the EnS, for baseline and the HadCM3-A1 scenario are<br />
mapped in Fig. 3 for 13 aggregated environmental zones<br />
(EnZ). With these maps, all modelled potential impacts on<br />
<strong>ecosystem</strong>s can be placed consistently in their environmental<br />
context.<br />
Within an environmental stratum, <strong>ecosystem</strong> service<br />
indica<strong>to</strong>rs can be expressed relative <strong>to</strong> a reference value.<br />
While any reference value is inevitably arbitrary, in order <strong>to</strong><br />
Table 2<br />
Example <strong>of</strong> <strong>change</strong>s in the ‘farmer livelihood’ indica<strong>to</strong>r (i.e. percentage <strong>of</strong> gird cell with agricultural <strong>land</strong> <strong>use</strong>) in four grid cells and two different environments<br />
between two time slices (t and t +1)<br />
Environment 1 Environment 2<br />
Grid cell A Grid cell B Grid cell C Grid cell D<br />
t t+1 t t +1 t t +1 t t +1<br />
Farmer livelihood 30 24 10 8 80 64 50 40<br />
Absolute <strong>change</strong> 6 2 16 10<br />
Relative <strong>change</strong> (%) 20 20 20 20<br />
Absolute <strong>change</strong> is not a suitable indica<strong>to</strong>r for potential impact beca<strong>use</strong> it is correlated <strong>to</strong> environmental conditions. Relative <strong>change</strong> is also not a good measure<br />
beca<strong>use</strong> the same value (here 20%) can occur represent very different impacts.
74<br />
M.J. Metzger et al. / Agriculture, Ecosystems and Environment 114 (2006) 69–85<br />
Fig. 4. Stratified <strong>ecosystem</strong> service supply for the <strong>ecosystem</strong> service indica<strong>to</strong>r farmer livelihood. <strong>The</strong> <strong>ecosystem</strong> service supply maps for ‘farmer livelihood’<br />
(Fig. 1) are stratified by the environmental strata (Fig. 3).<br />
make comparisons it is important that the stratification is<br />
preformed consistently. <strong>The</strong> reference value <strong>use</strong>d in this<br />
assessment is the highest <strong>ecosystem</strong> service value achieved<br />
in an environmental stratum. This measure can be compared<br />
<strong>to</strong> the concept <strong>of</strong> potential yield, defined by growth limiting<br />
environmental fac<strong>to</strong>rs (Van Ittersum et al., 2003). For a grid<br />
cell in a given EnS stratum, the fraction <strong>of</strong> the modelled<br />
<strong>ecosystem</strong> service provision relative <strong>to</strong> the highest achieved<br />
<strong>ecosystem</strong> service value in the region (ESref) is calculated,<br />
giving a unitless stratified value <strong>of</strong> the <strong>ecosystem</strong> service<br />
provision (ESstr) with a 0–1 range for the <strong>ecosystem</strong> service<br />
in the grid cell (cf. Eq. (4)). Thus ESref is unique for each<br />
<strong>ecosystem</strong> service indica<strong>to</strong>r, time slice, scenario, and EnS<br />
stratum:<br />
<strong>to</strong> the environment have a positive <strong>change</strong> in potential<br />
impact and vice versa (see Fig. 5). This <strong>change</strong> in ESstr<br />
(Eq. (5)) gives a measure <strong>of</strong> stratified potential impact<br />
(PIstr), which is <strong>use</strong>d <strong>to</strong> estimate <strong>vulnerability</strong> (see below):<br />
PIstrðes; x; s; tÞ<br />
¼ ESstrðes; x; s; tÞ ESstrðes; x; s; baselineÞ (5)<br />
where PIstr is the stratified potential impact, ESstr the<br />
stratified <strong>ecosystem</strong> service provision, es the <strong>ecosystem</strong><br />
service, x the grid cell, s the scenario, t the time slice,<br />
and baseline is the 1990.<br />
ESstrðes; x; s; tÞ ¼<br />
ESðes; x; s; tÞ<br />
ESrefðes; ens; s; tÞ<br />
(4)<br />
where ESstr is the stratified <strong>ecosystem</strong> service provision, ES<br />
the <strong>ecosystem</strong> service provision, ESref the highest achieved<br />
<strong>ecosystem</strong> service value, es the <strong>ecosystem</strong> service, x the grid<br />
cell, s the scenario, t the time slice, and ens is an environmental<br />
stratum.<br />
In this way a map is created in which potential impacts on<br />
<strong>ecosystem</strong> <strong>services</strong> are stratified by their environment and<br />
expressed relative <strong>to</strong> a reference value (Fig. 4). Beca<strong>use</strong> the<br />
environment <strong>change</strong>s over time, both the reference value and<br />
the environmental stratification are determined for each time<br />
slice. As shown in Fig. 4, the stratified <strong>ecosystem</strong> service<br />
provision map shows more regional detail than the original<br />
non-stratified map. This is the regional detail required <strong>to</strong><br />
compare potential impacts across regions (see also Table 3).<br />
<strong>The</strong> <strong>change</strong> in stratified <strong>ecosystem</strong> service provision<br />
compared <strong>to</strong> baseline conditions shows how <strong>change</strong>s in<br />
<strong>ecosystem</strong> <strong>services</strong> affect a given location (see also Table 3).<br />
Regions where <strong>ecosystem</strong> service supply increases relative<br />
Fig. 5. Stratified potential impact for the <strong>ecosystem</strong> service indica<strong>to</strong>r<br />
‘farmer livelihood’. Positive values indicate an increase <strong>of</strong> <strong>ecosystem</strong><br />
service provision relative <strong>to</strong> environmental conditions, and therefore a<br />
positive potential impact, while negative potential impacts are the result<br />
<strong>of</strong> a relative decrease in <strong>ecosystem</strong> service provision compared <strong>to</strong> 1990.
M.J. Metzger et al. / Agriculture, Ecosystems and Environment 114 (2006) 69–85 75<br />
Table 3<br />
<strong>The</strong> environmental conditions for high farmer livelihood decreases over time in Environment 1, and increases over time in Environment 2<br />
Environment 1 Environment 2<br />
Grid cell A Grid cell B Grid cell C Grid cell D<br />
t t+1 t t+1 t t +1 t t +1<br />
Farmer livelihood 30 24 10 8 80 64 50 40<br />
Highest <strong>ecosystem</strong> service value (ESref) 30 27 30 27 80 88 80 88<br />
Stratified <strong>ecosystem</strong> service provision (ESstr) 1.0 0.9 0.3 0.3 1.0 0.7 0.6 0.5<br />
Stratified potential impact index (PIstr) 0.1 0.0 0.3 0.1<br />
When <strong>change</strong>s are stratified by their environment, comparison <strong>of</strong> potential impacts in their specific environmental context is possible. <strong>The</strong> ‘‘stratified potential<br />
impact’’ is the ‘‘value in a grid cell’’ divided by the ‘‘highest <strong>ecosystem</strong> service value’’ in a specific environmental stratum at a specific time slice (see text).<br />
2.4. Adaptive capacity index<br />
Adaptation in general is unders<strong>to</strong>od as an adjustment in<br />
natural or human systems in response <strong>to</strong> actual or expected<br />
environmental <strong>change</strong>, which moderates harm or exploits<br />
beneficial opportunities. Here, adaptive capacity reflects the<br />
potential <strong>to</strong> implement planned adaptation measures and is,<br />
therefore, concerned with deliberate human attempts <strong>to</strong><br />
adapt <strong>to</strong> or cope with <strong>change</strong>. ‘Au<strong>to</strong>nomous adaptation’ by<br />
contrast, does not constitute a conscious response (e.g.<br />
spontaneous ecological <strong>change</strong>s). <strong>The</strong> concept <strong>of</strong> adaptive<br />
capacity was introduced in the IPCC TAR (IPCC, 2001a),<br />
according <strong>to</strong> which the fac<strong>to</strong>rs that determine adaptive<br />
capacity <strong>to</strong> climate <strong>change</strong> include economic wealth,<br />
technology and infrastructure, information, knowledge<br />
and skills, institutions, equity and social capital. Thus far,<br />
only one study has made an attempt at quantifying adaptive<br />
capacity based on observations <strong>of</strong> past hazard events (Yohe<br />
and Tol, 2002). For the <strong>vulnerability</strong> assessment framework,<br />
present-day and future estimates <strong>of</strong> adaptive capacity were<br />
sought that would be quantitative, spatially explicit, and<br />
based on, as well as consistent with, the SRES s<strong>to</strong>rylines<br />
described above. A generic index was developed <strong>of</strong> macroscale<br />
adaptive capacity. Four steps were followed <strong>to</strong> derive<br />
the adaptive capacity indices:<br />
1. development <strong>of</strong> a socio-economic framework using<br />
indica<strong>to</strong>r-based approach;<br />
2. estimation <strong>of</strong> future values <strong>of</strong> the indica<strong>to</strong>rs using<br />
regression models;<br />
3. aggregation <strong>of</strong> the estimated values <strong>of</strong> the indica<strong>to</strong>rs<br />
using fuzzy models;<br />
4. validity tests <strong>of</strong> the fuzzy models using uncertainty and<br />
sensitivity analyses.<br />
Based on literature review, six determinants were<br />
selected as a basis for building a framework <strong>of</strong> adaptive<br />
capacity (Schröter et al., 2003; Klein et al., 2005 in<br />
preparation <strong>to</strong> be submitted <strong>to</strong> Global Environmental<br />
Change Part A: Human and Policy Dimensions). Two<br />
socio-economic indica<strong>to</strong>rs were <strong>use</strong>d <strong>to</strong> represent each<br />
determinant <strong>of</strong> adaptive capacity. <strong>The</strong> framework thus<br />
includes 12 indica<strong>to</strong>rs, as indicated in Fig. 6. Time-series<br />
data for each <strong>of</strong> the 12 indica<strong>to</strong>rs was collected for regional<br />
administrative units <strong>of</strong> the countries in the project.<br />
Regression techniques were applied <strong>to</strong> the data <strong>to</strong> estimate<br />
the future values <strong>of</strong> the indica<strong>to</strong>rs for different time slices<br />
(2000, 2020, 2050, and 2080) and for each SRES s<strong>to</strong>ryline.<br />
Fuzzy logic was <strong>use</strong>d <strong>to</strong> aggregate the estimated values <strong>of</strong><br />
the indica<strong>to</strong>rs <strong>to</strong> generate the adaptive capacity index. This<br />
technique <strong>of</strong>fers flexible means <strong>to</strong> assess the numerical<br />
values <strong>of</strong> the indica<strong>to</strong>rs through the linguistic values and s<strong>of</strong>t<br />
thresholds <strong>of</strong> the membership functions (Cornelissen et al.,<br />
2001; Eierdanz et al., Mitigation and Adaptation Strategies<br />
for Global Change, submitted for publication). This<br />
flexibility is relevant for evaluating concepts such as<br />
adaptive capacity, which as yet does not have an objective<br />
yardstick <strong>to</strong> assess its relative magnitude. <strong>The</strong> validity <strong>of</strong> the<br />
fuzzy models, in particular with respect <strong>to</strong> the thresholds and<br />
gradients <strong>of</strong> the membership functions, was tested using<br />
uncertainty analysis.<br />
An illustrative example <strong>of</strong> the developments <strong>of</strong> the<br />
adaptive capacity index over time is given in Fig. 7.<br />
Different regions in Europe show different adaptive<br />
capacities. For baseline conditions, adaptive capacity is<br />
lowest in southern European countries, which score<br />
relatively low values for the AC indica<strong>to</strong>rs listed in<br />
Fig. 6. Under the global economic (A1) scenario, the<br />
adaptive capacity index becomes higher across Europe,<br />
since global markets lead <strong>to</strong> positive development for most<br />
<strong>of</strong> the AC indica<strong>to</strong>rs (see Fig. 6). In the southern European<br />
countries some <strong>of</strong> the AC indica<strong>to</strong>rs increase rapidly under<br />
this scenario, e.g. in Spain ‘female activity rate’ is projected<br />
<strong>to</strong> rise from 35% <strong>to</strong> 60%, and in Italy there is a projected rise<br />
in the number <strong>of</strong> doc<strong>to</strong>rs from approximately 6 <strong>to</strong> 11 per<br />
1000 inhabitants. Nevertheless, the adaptive capacity <strong>of</strong> the<br />
southern European countries remains lower than for<br />
northern European countries.<br />
2.5. Vulnerability maps<br />
<strong>The</strong> different elements <strong>of</strong> the <strong>vulnerability</strong> function<br />
(Eq. (3)) have now been quantified, as summarised in Fig. 8.<br />
<strong>The</strong> last step, the combination <strong>of</strong> the stratified potential<br />
impact (PIstr) and the adaptive capacity index (AC), is<br />
however the most difficult step, especially when taking in<strong>to</strong>
76<br />
M.J. Metzger et al. / Agriculture, Ecosystems and Environment 114 (2006) 69–85<br />
Fig. 6. Indica<strong>to</strong>r framework <strong>use</strong>d <strong>to</strong> develop the adaptive capacity model.<br />
account the limited empirical basis <strong>of</strong> the adaptive capacity<br />
index. It was therefore decided <strong>to</strong> create a visual<br />
combination <strong>of</strong> PIstr and AC without quantifying a specific<br />
relationship between them. <strong>The</strong> <strong>vulnerability</strong> maps illustrate<br />
which areas are vulnerable. For further analytical purposes<br />
the constituents <strong>of</strong> <strong>vulnerability</strong>, the <strong>change</strong>s in potential<br />
impact and the adaptive capacity index, are viewed<br />
separately.<br />
Trends in <strong>vulnerability</strong> follow the trend in PIstr: when<br />
<strong>ecosystem</strong> service supply decreases, humans relying on that<br />
particular <strong>ecosystem</strong> service become more vulnerable in that<br />
region. Alternatively, <strong>vulnerability</strong> decreases when <strong>ecosystem</strong><br />
service supply increases. Adaptive capacity lowers<br />
<strong>vulnerability</strong>. In regions with similar <strong>change</strong>s in potential<br />
impact, a region with a high AC will be less vulnerable than<br />
a region with a low AC. <strong>The</strong> PIstr determines the Hue,<br />
ranging from red (decreasing <strong>ecosystem</strong> service provision,<br />
PIstr = 1, highest negative potential impact) through<br />
yellow (no <strong>change</strong> in <strong>ecosystem</strong> service provision, PIstr = 0,<br />
no potential impact) <strong>to</strong> green (increase in <strong>ecosystem</strong> service<br />
Fig. 7. Socio-economic indica<strong>to</strong>rs have been aggregated <strong>to</strong> a generic adaptive capacity index. Trends in the original indica<strong>to</strong>rs were linked <strong>to</strong> the SRES<br />
s<strong>to</strong>rylines in order <strong>to</strong> map adaptive capacity in the 21st century.
M.J. Metzger et al. / Agriculture, Ecosystems and Environment 114 (2006) 69–85 77<br />
Fig. 8. Summary <strong>of</strong> the ATEAM approach <strong>to</strong> quantify <strong>vulnerability</strong>. Global <strong>change</strong> s<strong>to</strong>rylines and scenarios were <strong>use</strong>d <strong>to</strong> produce the <strong>land</strong> <strong>use</strong> <strong>change</strong> scenarios.<br />
<strong>The</strong>se were linked <strong>to</strong> several <strong>ecosystem</strong> service indica<strong>to</strong>rs, and provide maps <strong>of</strong> <strong>ecosystem</strong> <strong>services</strong> provision for a 10 0 10 0 spatial grid <strong>of</strong> Europe. <strong>The</strong> socialeconomic<br />
scenarios are <strong>use</strong>d <strong>to</strong> project developments in macro-scale adaptive capacity. <strong>The</strong> climate <strong>change</strong> scenarios are <strong>use</strong>d <strong>to</strong> create a scheme for stratifying<br />
<strong>ecosystem</strong> service provision <strong>to</strong> a regional environmental context. Changes in the stratified <strong>ecosystem</strong> service provision compared <strong>to</strong> baseline conditions reflect<br />
the potential impact <strong>of</strong> a given location. <strong>The</strong> stratified potential impact and adaptive capacity indices can be combined, at least visually, <strong>to</strong> create European maps<br />
<strong>of</strong> regional <strong>vulnerability</strong> <strong>to</strong> <strong>change</strong>s in <strong>ecosystem</strong> service provision.<br />
provision, PIstr = 1, highest positive potential impact). Note<br />
that it is possible that while the modelled potential impact<br />
remains un<strong>change</strong>d, the stratified potential impact increases<br />
or decreases due <strong>to</strong> <strong>change</strong>s in the highest value <strong>of</strong><br />
<strong>ecosystem</strong> service supply in the environmental class (ESref).<br />
Thus, when the environment <strong>change</strong>s, this is reflected in the<br />
potential impact.<br />
Adaptive capacity determines colour saturation and<br />
ranges from 50% <strong>to</strong> 100% depending on the level <strong>of</strong> the<br />
AC. When the PIstr becomes more negative, a higher AC<br />
will lower the <strong>vulnerability</strong>, therefore a higher AC value has<br />
a lower saturation, resulting in a less bright shade <strong>of</strong> red.<br />
Alternatively, when <strong>ecosystem</strong> service supply increases<br />
(PIstr > 0), a higher AC value has a higher saturation,<br />
resulting in a brighter shade <strong>of</strong> green. Conversely, in areas <strong>of</strong><br />
negative impact, low AC gives brighter red, whereas in areas<br />
<strong>of</strong> positive impacts low AC gives less bright green. Fig. 9<br />
shows the <strong>vulnerability</strong> maps and the legend for ‘farmer<br />
livelihood’ under the A1 scenario for the HadCM3 GCM.<br />
Under this scenario farmer livelihood decreases in extensive<br />
agricultural areas. <strong>The</strong> role <strong>of</strong> AC becomes apparent in rural<br />
Fig. 9. Vulnerability maps for the <strong>ecosystem</strong> service indica<strong>to</strong>r ‘farmer<br />
livelihood’. <strong>The</strong>se maps combine information about stratified potential<br />
impact (Fig. 5) and adaptive capacity (Fig. 6), as illustrated by the legend.<br />
An increase <strong>of</strong> potential impact decreases <strong>vulnerability</strong> and visa versa. At<br />
the same time <strong>vulnerability</strong> is lowered by human adaptive capacity.
78<br />
M.J. Metzger et al. / Agriculture, Ecosystems and Environment 114 (2006) 69–85<br />
Table 4<br />
<strong>The</strong> relationship between ATEAM <strong>land</strong> <strong>use</strong> types (Rounsevell et al., this volume) and five <strong>ecosystem</strong> service indica<strong>to</strong>rs<br />
Land <strong>use</strong><br />
Ecosystem service indica<strong>to</strong>rs<br />
Regional food production Fibre production Energy production Farmer livelihood Outdoor recreation<br />
Urban<br />
Crop<strong>land</strong> U U U<br />
Grass<strong>land</strong> U U U<br />
Forest U U<br />
Bioenergy crops U U<br />
Protected crop<strong>land</strong> U U U U<br />
Protected grass<strong>land</strong> U U U<br />
Others<br />
U<br />
Surplus<br />
U<br />
France and Spain, where France is less vulnerable than Spain<br />
due <strong>to</strong> a higher AC, i.e. a supposed higher ability <strong>of</strong> the<br />
French agricultural sec<strong>to</strong>r <strong>to</strong> react <strong>to</strong> these potential impacts.<br />
2.6. Land <strong>use</strong> <strong>services</strong><br />
<strong>The</strong> ATEAM <strong>land</strong> <strong>use</strong> <strong>change</strong> scenarios (Rounsevell<br />
et al., this volume) were developed with the aim <strong>of</strong><br />
supporting the types <strong>of</strong> <strong>vulnerability</strong> assessments presented<br />
here. Within ATEAM, different <strong>ecosystem</strong> models were run<br />
with these scenarios <strong>to</strong> give insights in<strong>to</strong> the potential<br />
impacts <strong>of</strong> global <strong>change</strong> for different European sec<strong>to</strong>rs. <strong>The</strong><br />
<strong>ecosystem</strong> service indica<strong>to</strong>rs calculated by these models<br />
were analysed with the <strong>vulnerability</strong> methodology described<br />
in the previous sections (Metzger et al., 2004). This section<br />
describes how <strong>ecosystem</strong> service indica<strong>to</strong>rs can also be<br />
derived directly from the <strong>land</strong> <strong>use</strong> <strong>change</strong> scenarios. Results<br />
from the analysis <strong>of</strong> such indica<strong>to</strong>rs help in understanding<br />
the <strong>vulnerability</strong> <strong>of</strong> <strong>ecosystem</strong> <strong>services</strong> <strong>to</strong> <strong>land</strong> <strong>use</strong> <strong>change</strong>.<br />
<strong>The</strong> ATEAM <strong>land</strong> <strong>use</strong> scenarios, described in detail by<br />
Rounsevell et al. (this volume), were based on an<br />
interpretation <strong>of</strong> the SRES s<strong>to</strong>rylines (Nakicenovic et al.,<br />
2000) for Europe using models and/or approaches that were<br />
specific <strong>to</strong> each <strong>land</strong> <strong>use</strong> type; urban (Reginster and<br />
Rounsevell, in press), crop<strong>land</strong>, grass<strong>land</strong> and bioenergy<br />
crops (Ewert et al., 2005; Rounsevell et al., 2005) and forests<br />
(Kankaanpaa and Carter, 2004). <strong>The</strong> approach also<br />
identified evolving patterns <strong>of</strong> protected areas based either<br />
on conservation or recreation goals (Reginster et al., in<br />
preparation), as well as <strong>land</strong> areas without viable economic<br />
activities (termed ‘surplus’ <strong>land</strong>). <strong>The</strong> scenario methodology<br />
first estimated <strong>change</strong>s in <strong>land</strong> <strong>use</strong> quantities at aggregate<br />
spatial levels (e.g. countries or regions) from an interpretation<br />
<strong>of</strong> the European <strong>land</strong> <strong>use</strong> <strong>change</strong> drivers that were<br />
consistent with the SRES s<strong>to</strong>ryline descriptions. <strong>The</strong>se <strong>land</strong><br />
<strong>use</strong> quantities were then distributed geographically (<strong>to</strong> the<br />
10 0 ATEAM grid) using scenario-specific, spatial allocation<br />
rules <strong>to</strong> reflect alternative societal behaviour and policy<br />
goals. <strong>The</strong> final set <strong>of</strong> <strong>land</strong> <strong>use</strong> <strong>change</strong> scenarios provided a<br />
range <strong>of</strong> coherent visions <strong>of</strong> the future integrating alternative<br />
socio-economic development pathways with the impacts <strong>of</strong><br />
climate <strong>change</strong>.<br />
<strong>The</strong> provision <strong>of</strong> many <strong>ecosystem</strong> <strong>services</strong> relies directly<br />
on <strong>land</strong> <strong>use</strong>. For instance, food production relies on<br />
agricultural <strong>land</strong> <strong>use</strong>, wood production on forestry, and<br />
outdoor recreation on attractive <strong>land</strong>scapes. Table 4 shows<br />
how the different <strong>land</strong> <strong>use</strong> types from the ATEAM scenarios<br />
were aggregated <strong>to</strong> create indica<strong>to</strong>rs for five <strong>ecosystem</strong><br />
<strong>services</strong>. <strong>The</strong>se indica<strong>to</strong>rs are described briefly below.<br />
2.6.1. Fibre, energy and regional food production<br />
<strong>The</strong>se provisioning <strong>ecosystem</strong> <strong>services</strong> are most easily<br />
associated with types <strong>of</strong> <strong>land</strong> <strong>use</strong>. Food production can be<br />
directly related <strong>to</strong> agricultural <strong>land</strong> <strong>use</strong>, fibre production <strong>to</strong><br />
forestry and crop<strong>land</strong> and energy production <strong>to</strong> the area <strong>use</strong>d<br />
for bio-energy crops, as indicated in Table 4. <strong>The</strong> actual<br />
<strong>ecosystem</strong> service provision, in crop yield or timber<br />
increment, greatly depends on biophysical growing conditions.<br />
However, as discussed in Section 2.3, in order <strong>to</strong><br />
compare <strong>ecosystem</strong> <strong>services</strong> across Europe, differences<br />
ca<strong>use</strong>d by inherently different environments were removed<br />
using the stratification. <strong>The</strong>refore, for the <strong>vulnerability</strong><br />
concept <strong>use</strong>d here, the <strong>land</strong> <strong>use</strong> types form appropriate<br />
indica<strong>to</strong>rs for <strong>ecosystem</strong> service provision.<br />
In the <strong>land</strong> <strong>use</strong> <strong>change</strong> scenarios, reductions in<br />
agricultural <strong>land</strong> are an effect <strong>of</strong> intensification <strong>of</strong><br />
production in optimal regions. Hence, <strong>to</strong>tal food availability<br />
will not decrease. Nevertheless, decreasing regional food<br />
production does have consequences for consumers, beca<strong>use</strong><br />
regional food products are associated with variation as well<br />
as traditional foods. Furthermore, regionally produced food<br />
is frequently associated with high quality and safety<br />
standards. A more limited choice <strong>of</strong> foods, mass-produced<br />
in optimal locations will be seen as negative impacts by parts<br />
<strong>of</strong> society.<br />
2.6.2. Farmer livelihood<br />
<strong>The</strong> <strong>change</strong> in agricultural areas was <strong>use</strong>d as a proxy for<br />
the impacts <strong>of</strong> global <strong>change</strong> on the well-being <strong>of</strong> farmers,<br />
termed the farmer livelihood. <strong>The</strong> number <strong>of</strong> farmers (and<br />
workers) employed in agriculture is partly a function <strong>of</strong> the<br />
area <strong>of</strong> agricultural <strong>land</strong>, although cultural and economic<br />
fac<strong>to</strong>rs also play a role. For example, economies <strong>of</strong> scale<br />
seem largely responsible for the current, observed trend in
M.J. Metzger et al. / Agriculture, Ecosystems and Environment 114 (2006) 69–85 79<br />
increasing farm sizes and thus, fewer farms and farmers.<br />
Any reduction in the area <strong>of</strong> agricultural <strong>land</strong> <strong>use</strong> resulting<br />
from pressures on the agricultural sec<strong>to</strong>r will, therefore, lead<br />
<strong>to</strong> a reduction in the number <strong>of</strong> farmers. For this reason,<br />
changing <strong>land</strong> <strong>use</strong> areas were thought <strong>to</strong> be an appropriate<br />
measure <strong>of</strong> the impact <strong>of</strong> global <strong>change</strong> on farmers. <strong>The</strong> <strong>land</strong><br />
<strong>use</strong> scenarios presented here (Rounsevell et al., this volume)<br />
that did not have reductions in agricultural areas (e.g. the B2<br />
scenario) were based on an assumption <strong>of</strong> extensification<br />
(encouraged through market support or rural development<br />
mechanisms) and thus, maintenance <strong>of</strong> the status quo with<br />
respect <strong>to</strong> farmer numbers.<br />
2.6.3. Outdoor recreation<br />
Natural or traditional <strong>land</strong>scapes are suitable for outdoor<br />
recreation (e.g. hiking, cycling, hunting, camping). <strong>The</strong>se<br />
<strong>land</strong>scapes are not easily linked <strong>to</strong> the <strong>land</strong> <strong>use</strong> types in the<br />
ATEAM scenarios. For simplicity all non-urban <strong>land</strong> <strong>use</strong>s<br />
except conventional crop<strong>land</strong> (including bio-energy crops)<br />
were deemed suitable for outdoor recreation. Conventional<br />
crop<strong>land</strong> was not deemed suitable beca<strong>use</strong> it is mostly<br />
inaccessible for recreational purposes. Furthermore, the<br />
scenic value <strong>of</strong> crop<strong>land</strong> is considered <strong>to</strong> be lower than for<br />
grass<strong>land</strong>. Designated crop<strong>land</strong> was considered <strong>to</strong> include<br />
more traditional <strong>land</strong>scapes (e.g. small scale mosaic<br />
<strong>land</strong>scapes) and was therefore included in the indica<strong>to</strong>r.<br />
2.7. Analysis <strong>of</strong> the results<br />
<strong>The</strong> <strong>vulnerability</strong> maps give an intuitive overview for an<br />
<strong>ecosystem</strong> service indica<strong>to</strong>r for one scenario and for one<br />
time slice. It is however difficult <strong>to</strong> analyse the effects <strong>of</strong><br />
the four scenarios on the five <strong>ecosystem</strong> service indica<strong>to</strong>rs<br />
for a multitude <strong>of</strong> <strong>vulnerability</strong> maps. Furthermore,<br />
beca<strong>use</strong> the legend <strong>of</strong> these maps is two-dimensional<br />
(adaptive capacity and stratified potential impact), it is<br />
difficult <strong>to</strong> analyse the ca<strong>use</strong> <strong>of</strong> the <strong>vulnerability</strong>. A<br />
comprehensive way <strong>of</strong> analysing the <strong>vulnerability</strong> maps is<br />
<strong>to</strong> look at AC and PIstr separately. Scatter plots can be <strong>use</strong>d<br />
<strong>to</strong> summarise impacts for multiple scenarios in one plot. In<br />
the following sections AC and PIstr are summarised in<br />
scatter plots, showing heterogeneity in AC and PIstr across<br />
Europe, as well as differences in PIstr between <strong>ecosystem</strong><br />
service indica<strong>to</strong>rs.<br />
3. Results and discussion<br />
3.1. Adaptive capacity<br />
<strong>The</strong> capacity <strong>of</strong> different countries and regions in Europe<br />
<strong>to</strong> cope with the effects <strong>of</strong> global <strong>change</strong> is projected <strong>to</strong><br />
increase in the coming century. Regression analysis <strong>of</strong> timeseries<br />
data for the AC indica<strong>to</strong>rs (Fig. 6) indicated a positive<br />
relation between gross domestic product (GDP) and the<br />
indica<strong>to</strong>rs. <strong>The</strong>refore, the assumed economic growth is<br />
expected <strong>to</strong> have a positive influence on AC. While GDP<br />
growth is projected for all countries, countries that currently<br />
have a lower adaptive capacity (e.g. the Mediterranean<br />
countries) are most able <strong>to</strong> utilise the projected increase in<br />
wealth <strong>to</strong> substantially increase macro scale adaptive<br />
capacity (Fig. 10). In these regions, increased wealth is<br />
projected <strong>to</strong> have direct effects on the determinants <strong>of</strong> AC,<br />
as illustrated for the indica<strong>to</strong>rs ‘female activity rate’ and<br />
‘number <strong>of</strong> doc<strong>to</strong>rs’ in Section 2.4. Countries that already<br />
show a large AC will also benefit form a growing awareness<br />
<strong>of</strong> global <strong>change</strong> impacts, but <strong>to</strong> a lesser degree, as shown in<br />
Fig. 10. In some cases, a decreasing population trend will<br />
negatively affect flexibility, and thus AC. By the end <strong>of</strong> the<br />
century, the differences in AC across Europe converge.<br />
Nevertheless, there is still considerable variation, with<br />
larger AC in northern regions and lower AC in the<br />
Mediterranean countries, as shown in Fig. 11. Forthese<br />
countries, the development pathways associated with the<br />
scenarios have a large influence. <strong>The</strong> A1 (global-economic)<br />
scenario projects the greatest increase in AC, while the B2<br />
Fig. 10. Scatter plot showing the development <strong>of</strong> adaptive capacity (AC) in two Environmental Zones for the four SRES s<strong>to</strong>rylines. Although AC increases<br />
much more rapidly in the Mediterranean North than in the Atlantic North, <strong>to</strong>ward the end <strong>of</strong> the 21st century AC is still considerable higher in Atlantic North.
80<br />
M.J. Metzger et al. / Agriculture, Ecosystems and Environment 114 (2006) 69–85<br />
Fig. 11. Scatter plot <strong>of</strong> the mean adaptive capacity (AC) per Environmental Zone (EnZ) in 2080 for the four SRES s<strong>to</strong>rylines. AC in southern Europe is<br />
projected <strong>to</strong> remain lower than in northern Europe. <strong>The</strong> direction <strong>of</strong> future development is more important for AC in southern Europe than in northern Europe.<br />
(regional-environmental) scenario is associated with lower<br />
adaptive capacity.<br />
3.2. Potential impacts<br />
<strong>The</strong> stratified potential impacts (PIstr) are summarised<br />
per <strong>ecosystem</strong> service indica<strong>to</strong>r, in a similar manner <strong>to</strong><br />
adaptive capacity (Fig. 12). In order <strong>to</strong> further facilitate<br />
interpretation, PIstr is classified in<strong>to</strong> five categories, based<br />
on the full range <strong>of</strong> values. <strong>The</strong> classes range from very<br />
positive impacts (PIstr > 0.15), positive impacts (PIstr<br />
between 0.05 and 0.15), neutral (PIstr between 0.05 and<br />
0.05), negative (PIstr between 0.05 and 0.15), and<br />
very negative (PIstr < 0.15). <strong>The</strong> scatter plots in Fig. 12<br />
can now be <strong>use</strong>d <strong>to</strong> (1) compare the impacts on the different<br />
<strong>ecosystem</strong> service indica<strong>to</strong>rs, (2) compare the impacts<br />
between regions, and (3) compare the influence <strong>of</strong> the<br />
SRES scenarios. <strong>The</strong> conclusions <strong>of</strong> these three analyses<br />
are <strong>use</strong>d <strong>to</strong> draw more general conclusions about the<br />
<strong>vulnerability</strong> <strong>of</strong> the <strong>ecosystem</strong> service indica<strong>to</strong>rs <strong>to</strong> <strong>land</strong><br />
<strong>use</strong> <strong>change</strong>.<br />
<strong>The</strong> stratified potential impacts (PIstr) for the <strong>ecosystem</strong><br />
service indica<strong>to</strong>rs presented here are a direct result <strong>of</strong> the<br />
ATEAM <strong>land</strong> <strong>use</strong> <strong>change</strong> scenarios (Rounsevell et al., this<br />
volume). Ecosystem <strong>services</strong> relying on <strong>land</strong> <strong>use</strong> types that<br />
are projected <strong>to</strong> emerge, or expand, in the 21st century have<br />
a positive PIstr. This is the case for energy production, a<br />
function <strong>of</strong> the bio-fuel <strong>land</strong> <strong>use</strong>, and outdoor recreation,<br />
which is a function <strong>of</strong> the increasing <strong>land</strong> <strong>use</strong> type ‘forest’<br />
and the new type ‘surplus <strong>land</strong>’. <strong>The</strong> other <strong>ecosystem</strong><br />
service indica<strong>to</strong>rs rely heavily on the decreasing<br />
agricultural <strong>land</strong> <strong>use</strong> types, and therefore largely show<br />
negative potential impacts. Across the whole <strong>of</strong> Europe, the<br />
regional food production indica<strong>to</strong>r had the most negative<br />
PIstr scores.<br />
Fig. 12 shows that PIstr for energy production and<br />
outdoor recreation is positive or very positive for most<br />
regions in Europe. For the other <strong>ecosystem</strong> service<br />
indica<strong>to</strong>rs there is heterogeneity in the impacts between<br />
different regions <strong>of</strong> Europe. <strong>The</strong>re appears <strong>to</strong> be a trend<br />
<strong>to</strong>wards more negative PIstr for more southern environmental<br />
zones (EnZs). Especially the Mediterranean EnZs<br />
have many ‘very negative’ PIstr scores.<br />
<strong>The</strong>re is a strong influence <strong>of</strong> the SRES scenarios on<br />
PIstr. Nevertheless, the direction <strong>of</strong> PIstr, positive or<br />
negative, is not influenced by the scenarios. Strong<br />
economic development (the A scenarios), is associated<br />
with the largest <strong>land</strong> <strong>use</strong> <strong>change</strong>s (Rounsevell et al., this<br />
volume), which translates in<strong>to</strong> more extreme impacts than<br />
the scenarios associated with environmentally foc<strong>use</strong>d<br />
development (the B scenarios). Mediterranean North and<br />
South both face very negative impacts for regional food<br />
production, farmer livelihood, and fibre production under<br />
the A1 scenario. In Fig. 12, there does not appear <strong>to</strong> be a<br />
clear signal differentiating the global and regional<br />
scenarios (1 and 2, respectively). This is an artefact <strong>of</strong><br />
the aggregation in<strong>to</strong> five classes. In the original data a<br />
differentiation can be found, with lower impacts for the<br />
regionally oriented scenarios. However, the difference is<br />
far smaller than the differentiation between the A-, B-<br />
scenarios, and not distinct enough <strong>to</strong> appear in the<br />
aggregation.
M.J. Metzger et al. / Agriculture, Ecosystems and Environment 114 (2006) 69–85 81<br />
Fig. 12. Five scatter plots showing stratified potential impact (PIstr) <strong>of</strong> <strong>ecosystem</strong> service indica<strong>to</strong>rs, in five categories, per Environmental Zone for the SRES<br />
s<strong>to</strong>rylines.<strong>The</strong>seplotsillustratethedifferencesbetween<strong>ecosystem</strong><strong>services</strong>,thevariabilityacrosstheEuropeanenvironment,andtheinfluence<strong>of</strong>theSRESs<strong>to</strong>rylines.<br />
3.3. Vulnerability<br />
Adaptive capacity and potential impact are quantified<br />
and analyzed for the principal European Environmental<br />
Zones (in Figs. 10 and 12, respectively). By combining<br />
the findings from these graphs it is possible <strong>to</strong> make<br />
some general statements about the <strong>vulnerability</strong><br />
<strong>of</strong> the <strong>ecosystem</strong> <strong>services</strong> <strong>to</strong> <strong>land</strong> <strong>use</strong> <strong>change</strong>,<br />
without quantifying the relative contribution <strong>of</strong> PI and<br />
AC.
82<br />
M.J. Metzger et al. / Agriculture, Ecosystems and Environment 114 (2006) 69–85<br />
<strong>The</strong> northern EnZs (Alpine North, Boreal, Nemoral,<br />
Atlantic North) are projected <strong>to</strong> have a high AC under all<br />
SRES scenarios (Fig. 10). Furthermore, PIstr reaches the<br />
‘very negative’ category in just 3 <strong>of</strong> the 48 possible<br />
combinations <strong>of</strong> EnZ (4), scenario (4) and <strong>ecosystem</strong> service<br />
(3, which have negative impacts) (see also Fig. 11). From<br />
this we can conclude that northern Europe is less likely <strong>to</strong> be<br />
vulnerable <strong>to</strong> projected <strong>land</strong> <strong>use</strong> <strong>change</strong>s. <strong>The</strong> <strong>ecosystem</strong><br />
service indica<strong>to</strong>rs that rely on agricultural <strong>land</strong> <strong>use</strong>s do show<br />
a negative PIstr, but the high level <strong>of</strong> AC compensates for<br />
this in the final <strong>vulnerability</strong>. Conversely, southern EnZs<br />
(Lusitanian, Mediterranean zones) have a lower AC than the<br />
northern regions (Fig. 10) and PIstr reaches the ‘very<br />
negative’ category in 16 <strong>of</strong> the 48 possible combinations.<br />
Southern Europe, therefore, seems considerably more<br />
vulnerable than Northern Europe, especially for <strong>ecosystem</strong><br />
<strong>services</strong> relying on agriculture.<br />
Combining findings about AC and PIstr in<strong>to</strong> conclusions<br />
about <strong>vulnerability</strong> shows a strong tension around economic<br />
growth in southern Europe. Economic growth is projected <strong>to</strong><br />
lead <strong>to</strong> greater technological development, infrastructure,<br />
equity, and power, and thus <strong>to</strong> a higher AC. But at the same<br />
time, the SRES scenarios associated with the strongest<br />
economic growth (A1 and A2) are the scenarios with the<br />
largest <strong>land</strong> <strong>use</strong> <strong>change</strong>s and the most negative PIstr: 13<br />
times the ‘very negative’ PIstr category in 24 possible<br />
combinations <strong>of</strong> EnZ (4), scenario (2) and <strong>ecosystem</strong> service<br />
(3). For the B1 and B2 environmentally oriented scenarios,<br />
PIstr reaches the ‘very negative’ category just 3 times in 24<br />
possible combinations. More specific statements about<br />
<strong>vulnerability</strong> for southern Europe, therefore, require a better<br />
understanding <strong>of</strong> the relationship between economic growth<br />
and AC.<br />
3.4. Land <strong>use</strong> scenarios in <strong>vulnerability</strong> assessment<br />
Scenarios are <strong>use</strong>ful for exploring uncertainties in<br />
<strong>vulnerability</strong> assessment on a regional basis, e.g. some<br />
regions show equal <strong>vulnerability</strong> <strong>to</strong> all scenarios, whilst<br />
other regions show different responses. This is an indica<strong>to</strong>r<br />
for where we can be more, or less, uncertain about the future.<br />
Furthermore, it helps in indicating how society and policy<br />
can have an important role <strong>to</strong> play in future development<br />
pathways.<br />
Vulnerability assessment provides a means <strong>of</strong> adding<br />
value <strong>to</strong> <strong>land</strong> <strong>use</strong> <strong>change</strong> scenarios by translating <strong>land</strong> <strong>use</strong><br />
maps in<strong>to</strong> information that is more directly relevant <strong>to</strong><br />
people. This includes an examination <strong>of</strong> the <strong>vulnerability</strong><br />
implications <strong>of</strong> <strong>land</strong> <strong>use</strong> <strong>change</strong> for different groups <strong>of</strong><br />
people. For example the simple indica<strong>to</strong>rs <strong>use</strong>d here were<br />
able <strong>to</strong> address the <strong>vulnerability</strong> <strong>of</strong> the suppliers <strong>of</strong><br />
agricultural products (i.e. farmers and the communities that<br />
depend on farming) through the farmer livelihood indica<strong>to</strong>r<br />
as well as the consumers <strong>of</strong> those products through the<br />
regional food quality indica<strong>to</strong>rs. Such analyses add richness<br />
<strong>to</strong> scenario development exercises that go beyond simple<br />
representations <strong>of</strong> <strong>land</strong> <strong>use</strong> on maps. <strong>The</strong>y do more than just<br />
explain why <strong>land</strong> <strong>use</strong> <strong>change</strong> occurs, by also identifying why<br />
these <strong>change</strong>s are important. Furthermore, possible conflicts<br />
between vulnerable groups detected (e.g. between farmers<br />
and taxpayers). This is the type <strong>of</strong> information for example<br />
that can be <strong>of</strong> interest <strong>to</strong> policy makers and society at large,<br />
and can help influence future development pathways. By<br />
extension, more detailed <strong>land</strong> <strong>use</strong> scenarios provide the<br />
opportunity <strong>to</strong> explore more detailed indica<strong>to</strong>rs <strong>of</strong> <strong>vulnerability</strong><br />
provided the scenarios are constructed <strong>to</strong> a consistent<br />
framework.<br />
3.5. Assumptions and uncertainties<br />
Studies concerned with future developments are necessarily<br />
based on a many assumptions, and clouded by<br />
uncertainty. It is important <strong>to</strong> recognise this, making<br />
assumptions explicit, and discussing uncertainties. For the<br />
present study, three categories <strong>of</strong> assumptions can be<br />
discerned: (1) those associated with the SRES s<strong>to</strong>rylines, (2)<br />
those associated with the various scenarios based on these<br />
s<strong>to</strong>rylines, and (3) those associated specifically with the<br />
<strong>vulnerability</strong> framework. <strong>The</strong> first two categories are only<br />
briefly discussed here, as they are published elsewhere.<br />
Assumptions and uncertainties related <strong>to</strong> the <strong>vulnerability</strong><br />
assessment are discussed in more detail.<br />
SRES (Nakicenovic et al., 2000) consists <strong>of</strong> a<br />
comprehensive set <strong>of</strong> narratives that define the local,<br />
regional and global socio-economic driving forces <strong>of</strong><br />
environmental <strong>change</strong> (e.g. demography, economy, technology,<br />
energy, and agriculture). <strong>The</strong> s<strong>to</strong>rylines provide<br />
alternative images <strong>of</strong> how the future might unfold and can<br />
act as an integration <strong>to</strong>ol in the assessment <strong>of</strong> global<br />
<strong>change</strong> impacts. Beca<strong>use</strong> we cannot attach probability <strong>to</strong><br />
any given s<strong>to</strong>ryline, they can help stimulate open<br />
discussion. It is however important <strong>to</strong> realize that all<br />
s<strong>to</strong>rylines are essentially arbitrary and therefore do not<br />
likely depict the most realistic future. <strong>The</strong> SRES s<strong>to</strong>rylines<br />
were <strong>use</strong>d <strong>to</strong> develop internally consistent scenarios for<br />
climate and <strong>land</strong> <strong>use</strong> <strong>change</strong>. <strong>The</strong> four s<strong>to</strong>rylines <strong>use</strong>d in<br />
ATEAM cover 93% <strong>of</strong> the range <strong>of</strong> possible global<br />
warming presented by IPCC (Nakicenovic et al., 2000).<br />
Uncertainties and assumptions for these datasets are<br />
discussed, respectively, by Mitchell et al. (2004) and<br />
Rounsevell et al. (this volume).<br />
For the present study, simplistic assumptions were made<br />
in order <strong>to</strong> link the ATEAM <strong>land</strong> <strong>use</strong> scenarios <strong>to</strong> different<br />
<strong>ecosystem</strong> <strong>services</strong> (cf. Table 4). <strong>The</strong>se <strong>ecosystem</strong> service<br />
indica<strong>to</strong>rs are not very specific, and groups relying on these<br />
<strong>ecosystem</strong> <strong>services</strong> are heterogeneous. For instance, for<br />
mountaineers and hunters the outdoor recreation indica<strong>to</strong>r<br />
could be <strong>of</strong> interest. However, the mountaineer will not be<br />
interested in expansion <strong>of</strong> forest area, which will affect the<br />
indica<strong>to</strong>r. Other indica<strong>to</strong>rs can lead <strong>to</strong> similar interpretation<br />
problems. It is therefore important <strong>to</strong> communicate <strong>to</strong><br />
stakeholders what the indica<strong>to</strong>rs entail.
M.J. Metzger et al. / Agriculture, Ecosystems and Environment 114 (2006) 69–85 83<br />
<strong>The</strong> stratification adds additional conceptual complexity<br />
<strong>to</strong> the <strong>vulnerability</strong> framework, but is <strong>of</strong> importance for<br />
allowing comparison across the European environment.<br />
<strong>The</strong> environmental stratification that was <strong>use</strong>d (Metzger<br />
et al., 2005a; Metzger, 2005) is based on the ATEAM<br />
climate <strong>change</strong> scenarios. Some additional uncertainty is<br />
added by the statistical classification, as discussed by<br />
Metzger et al. (2005a) and Metzger (2005). However one <strong>of</strong><br />
the more pr<strong>of</strong>ound assumptions for the present study is the<br />
choice <strong>of</strong> the reference values (ESref). Any reference value<br />
that can be applied consistently across different <strong>ecosystem</strong><br />
<strong>services</strong> will necessarily be arbitrary. <strong>The</strong> choice for the<br />
highest value <strong>of</strong> the <strong>ecosystem</strong> service indica<strong>to</strong>r with the<br />
EnS stratum was based on the conceptual notion that<br />
potential values <strong>of</strong> the indica<strong>to</strong>r is restricted by environmental<br />
constraints. While this works well for <strong>ecosystem</strong><br />
indica<strong>to</strong>rs that are directly correlated with wider environmental<br />
or climatic patterns, it could have significant<br />
implications when the maximum value in an outlier within<br />
the stratum. However, for the <strong>land</strong> <strong>use</strong> indica<strong>to</strong>rs in the<br />
present study, the potential range <strong>of</strong> values for the indica<strong>to</strong>rs<br />
is restricted by the fact that grid cells cannot be covered by<br />
more than 100%.<br />
<strong>The</strong> adaptive capacity indica<strong>to</strong>r framework forms the first<br />
scenario-based model <strong>of</strong> adaptive capacity. It forms a good<br />
basis for discussion on the future ability <strong>to</strong> cope with<br />
projected <strong>change</strong>s, but it is based on several uncertain<br />
assumptions. Firstly, the conceptual indica<strong>to</strong>r framework<br />
(Fig. 6), while based on current scientific understanding <strong>of</strong><br />
AC, is in part arbitrary, and <strong>change</strong>s in the choice <strong>of</strong><br />
indica<strong>to</strong>rs could influence the outcome <strong>of</strong> the indica<strong>to</strong>r. A<br />
second major source <strong>of</strong> uncertainty is the assumption that<br />
his<strong>to</strong>rical trends in the relation between the 12 indica<strong>to</strong>rs <strong>of</strong><br />
AC and GDP and population, based on time-series data for<br />
the last 30 years, will remain the same in the 21st century.<br />
Finally, there are uncertainties associated with the fuzzy<br />
aggregation <strong>of</strong> the 12 indica<strong>to</strong>rs <strong>to</strong> a single index. Validation<br />
<strong>of</strong> the adaptive capacity index is difficult, or perhaps<br />
impossible, making it difficult <strong>to</strong> quantify uncertainties.<br />
This last stage <strong>of</strong> the <strong>vulnerability</strong> framework, combining<br />
the stratified potential impacts and the adaptive capacity<br />
indica<strong>to</strong>r in<strong>to</strong> intuitive <strong>vulnerability</strong> maps also includes<br />
some arbitrary choices, especially in the scaling <strong>of</strong> the<br />
adaptive capacity index (saturation). <strong>The</strong> relative contribution<br />
<strong>of</strong> AC will probably differ between sec<strong>to</strong>rs, across<br />
<strong>ecosystem</strong> <strong>services</strong>, and perhaps between regions. <strong>The</strong><br />
present approach gives an initial indication <strong>of</strong> the<br />
combination <strong>of</strong> AC and PIstr in<strong>to</strong> <strong>vulnerability</strong>, but for<br />
specific issues they should be examined separately, and<br />
interpreted in combination with ancillary information and<br />
knowledge.<br />
3.6. Limitations in the approach<br />
As indicated previously, there is a demand for methods <strong>to</strong><br />
integrate multidisciplinary assessments and <strong>to</strong> incorporate<br />
measures <strong>of</strong> adaptive capacity (IPCC, 2001a; Kasperson and<br />
Kasperson, 2001; Schröter et al., 2005b). While such<br />
methods are aimed at synthesising findings, there is the risk<br />
<strong>of</strong> oversimplification or blurring initial findings with<br />
complex meta-analyses and added uncertainties. <strong>The</strong> present<br />
framework attempted <strong>to</strong> avoid oversimplification by<br />
providing separate <strong>vulnerability</strong> maps for each <strong>ecosystem</strong><br />
service output. Furthermore, for a better comprehension <strong>of</strong><br />
<strong>vulnerability</strong> it is important <strong>to</strong> analyse not only the<br />
<strong>vulnerability</strong> maps, but also the separate components <strong>use</strong>d<br />
<strong>to</strong> derive the <strong>vulnerability</strong> map. This approach, with a<br />
multitude <strong>of</strong> maps, has consequences for the ease <strong>of</strong><br />
interpretation. Scatter plots form an effective <strong>to</strong>ol for<br />
summarising multiple maps, but also require specific<br />
s<strong>of</strong>tware and computer skills. For the <strong>ecosystem</strong> service<br />
indica<strong>to</strong>rs modelled by the ATEAM <strong>ecosystem</strong> models, a<br />
separate s<strong>of</strong>tware shell was developed <strong>to</strong> facilitate such<br />
analyses (Metzger et al., 2004).<br />
Any processing <strong>of</strong> the modelled <strong>ecosystem</strong> <strong>services</strong> adds<br />
both complexity and uncertainty, as discussed in the<br />
previous section. In the present approach such additional<br />
complexity is added in (1) the stratification process, (2) in<br />
the Adaptive Capacity index, and (3) the visual combination<br />
<strong>of</strong> the two indices results in<strong>to</strong> <strong>vulnerability</strong> maps. As the<br />
approach is applied, more advanced methods <strong>of</strong> combining<br />
stratified potential impact (PIstr) and adaptive capacity (AC)<br />
may be developed, i.e. through fuzzy logic or qualitative<br />
differential equations. However, a prerequisite for this is the<br />
further understanding <strong>of</strong> how PIstr and AC interact and<br />
influence <strong>vulnerability</strong>.<br />
It is important <strong>to</strong> realize that the <strong>land</strong> <strong>use</strong> <strong>change</strong><br />
scenarios were developed <strong>to</strong> provide European results<br />
relevant for analysis at the European scale. As a<br />
consequence, regional heterogeneity in <strong>land</strong> <strong>use</strong> was<br />
ignored, and the number <strong>of</strong> <strong>land</strong> <strong>use</strong> types that could be<br />
distinguished was limited. As a result, more specific<br />
<strong>ecosystem</strong> <strong>services</strong>, and especially those related <strong>to</strong><br />
biodiversity and nature conservation, cannot be assessed.<br />
In addition, the agricultural <strong>land</strong> <strong>use</strong> scenarios appear <strong>to</strong> lack<br />
sensitivity <strong>to</strong> climate <strong>change</strong>. This is partly beca<strong>use</strong> the<br />
socio-economic drivers are more important than climate<br />
drivers within the <strong>land</strong> <strong>use</strong> <strong>change</strong> model, but also beca<strong>use</strong> <strong>of</strong><br />
the effects <strong>of</strong> scale. At the regional scale, there are winners<br />
and losers (in terms <strong>of</strong> crop yield <strong>change</strong>s in response <strong>to</strong><br />
climate <strong>change</strong>), but these tend <strong>to</strong> cancel each other out<br />
when aggregated <strong>to</strong> the whole <strong>of</strong> Europe (Ewert et al., 2005).<br />
Thus, the results suggest that at the European scale, crop<br />
productivity is not sensitive <strong>to</strong> climate <strong>change</strong>, whereas at<br />
the regional scale it could be very sensitive <strong>to</strong> climate <strong>change</strong><br />
depending on the region in question (Rounsevell et al.,<br />
2005). <strong>The</strong> models for the other <strong>land</strong> <strong>use</strong> types were not at all<br />
sensitive <strong>to</strong> climate <strong>change</strong>. For <strong>ecosystem</strong> <strong>services</strong> that are<br />
especially sensitive <strong>to</strong> climate, a <strong>vulnerability</strong> assessment<br />
based on only <strong>land</strong> <strong>use</strong> <strong>change</strong> does not suffice, and more<br />
specific attention should also be paid <strong>to</strong> the potential impacts<br />
<strong>to</strong> climate <strong>change</strong>.
84<br />
M.J. Metzger et al. / Agriculture, Ecosystems and Environment 114 (2006) 69–85<br />
3.7. Possible future developments and improvements<br />
<strong>The</strong> present approach was developed for the ATEAM<br />
project, but could equally well be <strong>use</strong>d in other assessments.<br />
Metzger et al. (2005b) have shown how biomes can be <strong>use</strong>d<br />
<strong>to</strong> stratify <strong>ecosystem</strong> service indica<strong>to</strong>rs from the global<br />
model IMAGE (IMAGE Team, 2001). <strong>The</strong>re are two<br />
limitations <strong>to</strong> applying the complete <strong>vulnerability</strong> framework<br />
<strong>to</strong> other modelling studies: both a quantitative<br />
stratification and some measure <strong>of</strong> adaptive capacity need<br />
<strong>to</strong> be available. For European assessments such (e.g.<br />
EURURALIS (Klijn et al., 2005)) this should not pose<br />
<strong>to</strong>o much <strong>of</strong> a problem, as the datasets <strong>use</strong>d in the presented<br />
study could be <strong>use</strong>d. For other regions, such datasets may<br />
need <strong>to</strong> be developed. Application <strong>of</strong> the <strong>vulnerability</strong><br />
framework <strong>to</strong> global <strong>change</strong> impacts in the arctic region are<br />
currently under discussion.<br />
Both the modelled <strong>change</strong>s in <strong>ecosystem</strong> service<br />
provision and the adaptive capacity index form <strong>to</strong>p-down<br />
projections which ignore regional heterogeneity. In a floodprone<br />
area in Germany it has recently been shown that<br />
‘‘perceived adaptive capacity’’ is a major determinant <strong>of</strong><br />
whether people will take adaptation measures or not<br />
(Grothmann and Reusswig, in press). It seems that more<br />
place based studies could better take account <strong>of</strong> the<br />
individual nature <strong>of</strong> <strong>vulnerability</strong>. One possible consistent<br />
method <strong>of</strong> analysis would be <strong>to</strong> assess impacts on detailed<br />
random sample areas (cf. Bunce and Harvey, 1987). For such<br />
sample areas it would also be possible <strong>to</strong> develop more<br />
detailed, regional <strong>land</strong> <strong>use</strong> <strong>change</strong> scenarios, by combining<br />
high-quality regional ancillary data sources, as discussed in<br />
Metzger (2005) for the impacts <strong>of</strong> shifting environments in<br />
four sample regions. Such regional scenarios can provide the<br />
detail required for analysing impacts on biodiversity or<br />
nature conservation. By constraining these scenarios with<br />
<strong>to</strong>p-down European scenarios, European and global socioeconomic<br />
trends can be taken in<strong>to</strong> account.<br />
4. Conclusions<br />
Land <strong>use</strong> <strong>change</strong> will have a large influence on important<br />
<strong>ecosystem</strong> <strong>services</strong> in Europe. Vulnerability <strong>to</strong> <strong>land</strong> <strong>use</strong><br />
<strong>change</strong> differs across European regions and between<br />
<strong>ecosystem</strong> <strong>services</strong>. While projected <strong>land</strong> <strong>use</strong> <strong>change</strong>s can<br />
be negative for one sec<strong>to</strong>r, other sec<strong>to</strong>rs could benefit. <strong>The</strong><br />
<strong>vulnerability</strong> concept <strong>use</strong>d in this paper allows different<br />
regions <strong>of</strong> Europe <strong>to</strong> be compared with respect <strong>to</strong> their<br />
<strong>vulnerability</strong> <strong>to</strong> <strong>change</strong>s in <strong>land</strong> <strong>use</strong> related <strong>ecosystem</strong><br />
<strong>services</strong> for alternative scenarios. <strong>The</strong>re are differences in<br />
potential impact for the different scenarios in most regions,<br />
with the most notable distinctions ca<strong>use</strong>d by differences in<br />
economic versus environmentally oriented development.<br />
<strong>The</strong>se differences are most pr<strong>of</strong>ound in southern Europe,<br />
where very negative impacts are foreseen for sec<strong>to</strong>rs relying<br />
on agricultural <strong>ecosystem</strong> <strong>services</strong> under the economically<br />
oriented development pathways associated with open<br />
markets. While the ability <strong>to</strong> cope with such negative<br />
impacts increases with growing economic development,<br />
southern Europe is projected <strong>to</strong> have a considerably lower<br />
adaptive capacity than northern Europe. From this, it can be<br />
concluded that the agricultural sec<strong>to</strong>rs in particular in<br />
southern European will be most vulnerable <strong>to</strong> projected <strong>land</strong><br />
<strong>use</strong> <strong>change</strong>s in Europe. However, the differences in both<br />
potential impacts and adaptive capacity between the four<br />
scenarios, shows that the vulnerably <strong>of</strong> southern Europe is<br />
strongly influenced by different development pathways.<br />
Society and policy will therefore play an important role in<br />
determining the eventual, residual impacts.<br />
Acknowledgements<br />
<strong>The</strong> work presented in this paper was carried out as part<br />
<strong>of</strong> the EU funded Fifth Framework project ATEAM<br />
(Advanced Terrestrial Ecosystem Assessment and Modelling,<br />
Project No. EVK2-2000-00075). We thank all members<br />
in the consortium who contributed <strong>to</strong> the discussions that<br />
helped shape the work in this paper. We thank René-Luc<br />
d’Hont for preparing the data for Fig. 2.<br />
References<br />
Alcamo, J., 2002. Introduction <strong>to</strong> special issue on regional air pollution and<br />
climate <strong>change</strong> in Europe. Environ. Sci. Policy 5 (4), 255.<br />
Bunce, R.G.H., Harvey, D.R., 1987. A methodology for the identification <strong>of</strong><br />
<strong>land</strong> areas with potential for energy and industrial agricultural production.<br />
In: Grassi, G., Delmon, B., Molle, J.-F., Zibetta, H. (Eds.), Biomass<br />
for Energy and Industry. Elsevier Applied Science, London, pp.<br />
1272–1278.<br />
Cornelissen, A.M.G., van den Berg, J., Koops, W.J., Grossman, M., Udo,<br />
H.M.J., 2001. Assessment <strong>of</strong> the contribution <strong>of</strong> sustainability indica<strong>to</strong>rs<br />
<strong>to</strong> sustainable development: a novel approach using fuzzy set theory.<br />
Agric. Ecosyst. Environ. 86, 173–185.<br />
Daily, G.C., 1997. Nature’s Services. Is<strong>land</strong> Press/Shearwater Books,<br />
Washing<strong>to</strong>n.<br />
Ekboir, J. (Ed.), 2002. CIMMYT 2000–2001 World Wheat Overview and<br />
Outlook: Developing No-Till Packages for Small-Scale Farmers. CIM-<br />
MYT, Mexico, DF.<br />
Ewert, F., Rounsevell, M.D.A., Reginster, I., Metzger, M.J., Leemans, R.,<br />
2005. Future scenarios <strong>of</strong> European agricultural <strong>land</strong> <strong>use</strong>. I. Estimating<br />
<strong>change</strong>s in crop productivity. Agric. Ecosyst. Environ. 107, 101–116.<br />
Galloway, J.N., 2001. Acidification <strong>of</strong> the world: natural and anthropogenic.<br />
Water Air Soil Pollut. 130, 17–24.<br />
Geist, H.J., Lambin, E.F., 2002. Proximate ca<strong>use</strong>s and underlying driving<br />
forces <strong>of</strong> tropical deforestation. Bioscience 52, 143–150.<br />
Grothmann, T., Reusswig, F., in press. People at risk <strong>of</strong> flooding: why some<br />
residents take precautionary action while others do not. Nat. Hazards.<br />
IMAGE team, 2001. <strong>The</strong> IMAGE 2.2 Implementation <strong>of</strong> the SRES Scenarios:<br />
A Comprehensive Analysis <strong>of</strong> Emissions, Climate Change and<br />
Impacts in the 21st Century. Dutch Institute <strong>of</strong> Public Health and the<br />
Environment (RIVM), Bilthoven, <strong>The</strong> Nether<strong>land</strong>s.<br />
IPCC, 2001a. Climate Change 2001: Impacts, Adaptation, and Vulnerability.<br />
Contribution <strong>of</strong> Working Group II <strong>to</strong> the third assessment report <strong>of</strong><br />
the Intergovernmental Panel on Climate Change (IPCC) Cambridge<br />
University Press, Cambridge.
M.J. Metzger et al. / Agriculture, Ecosystems and Environment 114 (2006) 69–85 85<br />
IPCC, 2001b. Climate Change 2001: Mitigation. Contribution <strong>of</strong> Working<br />
Group III <strong>to</strong> the third assessment report <strong>of</strong> the Intergovernmental Panel<br />
on Climate Change (IPCC) Cambridge University Press, Cambridge.<br />
IPCC, 2001c. Climate Change 2001: <strong>The</strong> Scientific Basis. Contribution <strong>of</strong><br />
Working Group I <strong>to</strong> the third assessment report <strong>of</strong> the Intergovernmental<br />
PanelonClimateChange(IPCC)CambridgeUniversityPress,Cambridge.<br />
Kankaanpaa, S., Carter, T.R., 2004. Construction <strong>of</strong> European Forest Land<br />
Use Scenarios for the 21st Century. <strong>The</strong> Finnish Environment 707.<br />
Finnish Environment Institute, Helsinki.<br />
Kasperson, J.X., Kasperson, R.E., 2001. SEI Risk and Vulnerability,<br />
Programme Report 2001-01. S<strong>to</strong>ckholm Environment Institute, S<strong>to</strong>ckholm,<br />
Sweden.<br />
Kates, R.W., Clark, W.C., Corell, R., Hall, J.M., Jaeger, C.C., Lowe, I.,<br />
McCarthy, J.J., Schellnhuber, H.-J., Bolin, B., Dickson, N.M., Faucheux,<br />
S., Gallopin, G.C., Grübler, A., Huntley, B., Jäger, J., Jodha, N.S.,<br />
Kasperson, R.E., Mabogunje, A., Matson, P.A., Mooney, H.A., Moore<br />
III, B., O’Riordan, T., Svedin, U., 2001. Sustainability science. Science<br />
292, 641–642.<br />
Klijn, J.A., Vullings, L.A.E., van den Berg, M., van Meijl, H., van<br />
Lammeren, R., van Rheenen, T., Veldkamp, A., Verburg, P.H.,<br />
Westhoek, H., Eickhout, B., 2005. <strong>The</strong> EURURALIS study: Technical<br />
document. Alterra-rapport 1196. Alterra, Wageningen.<br />
Lambin, E.F., Turner II, B.L., Geist, H.J., Agbola, S.B., Angelsen, A.,<br />
Bruce, J.W., Coomes, O., Dirzo, R., Fischer, G., Folke, C., George, P.S.,<br />
Homewood, K., Imbernon, J., Leemans, R., Li, X., Moran, E.F.,<br />
Mortimore, M., Ramakrishnan, P.S., Richards, J.F., Skånes, H., Steffen,<br />
W.L., S<strong>to</strong>ne, G.D., Svedin, U., Veldkamp, T.A., Vogel, C., Xu, J., 2001.<br />
<strong>The</strong> ca<strong>use</strong>s <strong>of</strong> <strong>land</strong> <strong>use</strong> and <strong>land</strong>-cover <strong>change</strong>: moving beyond the<br />
myths. Global Environ. Change: Hum. Policy Dimension 11, 261–269.<br />
Luers, A.L., Lobell, D.B., Sklar, L.S., Addams, C.L., Matson, P.A., 2003. A<br />
method for quantifying <strong>vulnerability</strong>, applied <strong>to</strong> the agricultural system<br />
<strong>of</strong> the Yaqui Valley, Mexico. Global Environ. Change 13, 255–267.<br />
Metzger, M.J., 2005. European <strong>vulnerability</strong> <strong>to</strong> global <strong>change</strong>, a spatially<br />
explicit and quantitative assessment. PhD thesis. Wageningen University,<br />
Wageningen, <strong>The</strong> Nether<strong>land</strong>s. Available at http://library.wur.nl/<br />
wda/dissertations/dis3849.pdf.<br />
Metzger, M.J., Leemans, R., Schröter, D., Cramer, W., the ATEAM consortium,<br />
2004. <strong>The</strong> ATEAM <strong>vulnerability</strong> mapping <strong>to</strong>ol. Quantitative<br />
Approaches in Systems Analysis No. 27, CD-ROM publication, Office<br />
C.T. de Wit Graduate School for Production Ecology & Resource<br />
Conservation (PE&RC), Wageningen, <strong>The</strong> Nether<strong>land</strong>s. Available at<br />
www.pik-potsdam.de/ateam/.<br />
Metzger, M.J., Bunce, R.G.H., Jongman, R.H.G., Mücher, C.A., Watkins,<br />
J.W., 2005a. A climatic stratification <strong>of</strong> the environment <strong>of</strong> Europe.<br />
Global Ecol. Biogeogr. 14, 549–563.<br />
Metzger, M.J., Leemans, R., Schröter, D., 2005b. A multidisciplinary multiscale<br />
framework for assessing <strong>vulnerability</strong> <strong>to</strong> global <strong>change</strong>. Int. J.<br />
Appl. Geo-inform. Earth Observ. 7, 253–267.<br />
Millenium Ecosystem Assessment, 2003. Ecosystems and Human Well-<br />
Being; a Framework for Assessment. Is<strong>land</strong> Press, Washing<strong>to</strong>n.<br />
Mitchell, T.D., Carter, T.R., Jones, P.D., Hulme, M., New, M., 2004. A<br />
comprehensive set <strong>of</strong> high-resolution grids <strong>of</strong> monthly climate for<br />
Europe and the globe: the observed record (1901–2000) and 16 scenarios<br />
(2001–2100). Tyndall Centre Working Paper No. 55. Tyndall Centre<br />
for Climate Change Research, University <strong>of</strong> East Anglia, Norwich, UK.<br />
Nakicenovic, N., Alcamo, J., Davis, G., de Vries, B., Fenhann, J., Gaffin, S.,<br />
Gregory, K., Grübler, A., Jung, T.Y., Kram, T., Emilio la overe, E.,<br />
Michaelis, L., Mori, S., Morita, T., Pepper, W., Pitcher, H., Price, L.,<br />
Riahi, K., Roehrl, A., Rogner, H.H., Sankovski, A., Schlesinger, M.,<br />
Shukla, P., Smith, S., Swart, R., van Rooyen, S., Vic<strong>to</strong>r, N., Dadi, Z.,<br />
2000. IPCC Special Report on Emissions Scenarios (SRES). Cambridge<br />
University Press, Cambridge.<br />
Reid, W.V., Mooney, H.A., Cropper, A., Capistrano, D., Carpenter, S.R.,<br />
Chopra, K., Dasgupta, P., Dietz, T., Duraiappah, A.K., Hassan, R.,<br />
Kasperson, R., Leemans, R., May, R.M., McMichael, A.J., Pingali, P.,<br />
Samper, C., Scholes, R., Watson, R.T., Zakri, A.H., Shidong, Z., Ash,<br />
N.J., Bennett, E., Kumar, P., Lee, M.J., Raudsepp-Hearne, C., Simons,<br />
H., Thonell, J., Zurek, N.B., 2005. Millennium Ecosystem Assessment<br />
Synthesis report. Is<strong>land</strong> Press, Washing<strong>to</strong>n, D.C..<br />
Reginster I., Rounsevell, M., in press. Scenarios <strong>of</strong> future urban <strong>land</strong> <strong>use</strong> in<br />
Europe. Environment and Planning B Planning and Design.<br />
Rounsevell, M.D.A., Ewert, F., Reginster, I., Leemans, R., Carter, T.R., 2005.<br />
Future scenarios <strong>of</strong> European agricultural <strong>land</strong> <strong>use</strong>. II. Projecting <strong>change</strong>s<br />
in crop<strong>land</strong> and grass<strong>land</strong>. Agric. Ecosyst. Environ. 107, 117–135.<br />
Schröter, D., Acosta-Michlik, L., Reidsma, P., Metzger, M.J., Klein, R.J.T.,<br />
2003. Modelling the Vulnerability <strong>of</strong> Eco-Social Systems <strong>to</strong> Global<br />
Change: Human Adaptive Capacity <strong>to</strong> Changes in Ecosystem Service<br />
Provision. Paper Presented at the Fifth Open Meeting <strong>of</strong> the Human<br />
Dimensions <strong>of</strong> Global Environmental Change Research Community,<br />
Montreal, Canada. Available online http://sedac.ciesin.columbia.edu/<br />
openmtg/.<br />
Schröter, D., Cramer, W., Leemans, R., Prentice, I.C., Araújo, M.B., Arnell,<br />
N.W., Bondeau, A., Bugmann, H., Carter, T.R., Garcia, C.A., de la Vega-<br />
Leinert, A.C., Erhard, M., Ewert, F., Glendining, M., Ho<strong>use</strong>, J.I., Kankaanpää,<br />
S., Klein, R.J.T., Lavorel, S., Lindner, M., Metzger, M.J., Meyer,<br />
J., Mitchell, T.D., Reginster, I., Rounsevell,M., Sabaté, S.,Sitch,S., Smith,<br />
B., Smith, J., Smith, P., Sykes, M.T., Thonicke, K., Thuiller, W., Tuck, G.,<br />
Zaehle, S., Zierl, B., 2005a. Ecosystem Service Supply and Human<br />
Vulnerability <strong>to</strong> Global Change in Europe. Science 310, 1333–1337.<br />
Schröter, D., Polsky, C., Patt, A.G., 2005b. Assessing vulnerabilities <strong>to</strong> the<br />
effects <strong>of</strong> global <strong>change</strong>: an eight step approach. Mitigat. Adaptat.<br />
Strategies Global Change 10, 573–595.<br />
Smith, J.B., Schellnhuber, H.J., Mirza, M., Fankha<strong>use</strong>r, S., Leemans, R.,<br />
Erda Lin, Ogallo, L., Pit<strong>to</strong>ck, B., Richels, R., Rosenzweig, C., Safriel,<br />
U., Tol, R.S.J., Weyant, J., Yohe, G., 2001. Vulnerability <strong>to</strong><br />
Climate Change and reasons for concern: a synthesis. In: McCarthy,<br />
J.J., Canziani, O.F., Leary, N.A., Dokken, D.J., White, K.S. (Eds.),<br />
Climate Change 2001. Impacts, Adaptation, and Vulnerability. Cambridge<br />
University Press, Cambridge, pp. 913–967.<br />
Steffen, W., Tyson, P., Jäger, J., Matson, P., Moore, B., Oldfield, F.,<br />
Richardson, K., Schelnhuber, J., Turner, B.L., Wasson, R., 2001. Global<br />
<strong>change</strong> and the earth system: a planet under pressure. IGBP Sci. 4, 2–32.<br />
Thomas, C.D., Cameron, A., Green, R.E., Bakkenes, M., Beaumont, L.J.,<br />
Collingham, Y.C., Erasmus, B.F.N., de Siqueira, M.F., Grainger, A.,<br />
Hannah, L., Hughes, L., Huntley, B., van Jaarsveld, A.S., Midgley,<br />
G.F., Miles, L., Ortega-Huerta, M.A., Peterson, A.T., Phillips, O.L.,<br />
Williams, S.E., 2004. Extinction risk from climate <strong>change</strong>. Nature 427<br />
(6970), 145–148.<br />
Thuiller, W., Araújo, M.B., Lavorel, S., 2004. Do we need <strong>land</strong>-cover data <strong>to</strong><br />
model species distributions in Europe? J. Biogeogr. 31 (3), 353–361.<br />
Turner II,B.L., Skole, D.L., Sanderson, S., Fischer, G., Fresco, L.O., Leemans,<br />
R., 1997. Land <strong>use</strong> and <strong>land</strong>-cover <strong>change</strong>. Earth Sci. Frontiers 4, 26–33.<br />
Turner, B.L., Kasperson, R.E., Matson, P., McCarthy, J.J., Corell, R.W.,<br />
Christensen, L., Eckley, N., Kasperson, J.X., Luers, A., Martello, M.L.,<br />
Polsky, C., Pulsipher, Schiller, A., 2003. A framework for <strong>vulnerability</strong><br />
analysis in sustainability science. Proc. Natl. Acad. Sci. U.S.A. 100,<br />
8074–8079.<br />
UNEP, 2002. GEO-3: Global Environmental Outlook Report 3. UNEP—<br />
United Nations Environment Programme.<br />
van Ittersum, M.K., Leffelaar, P.A., van Keulen, H., Kropff, M.J., Bastiaans,<br />
L., Goudriaan, J., 2003. On approaches and applications <strong>of</strong> the Wageningen<br />
crop models. Eur. J. Agron. 18, 201–234.<br />
Van der Meijden, R., van Duuren, L., Duistermaat, L.H., 1996. Standard list<br />
<strong>of</strong> the flora <strong>of</strong> the Nether<strong>land</strong>s 1996. Survey <strong>of</strong> <strong>change</strong>s since 1990.<br />
Gorteria 22, 1–5.<br />
Watson, R.T., Noble, I.R., Bolin, B., Ravindranath, N.H., Verardo, D.J.,<br />
Dokken, D.J. (Eds.), 2000. Land Use, Land <strong>use</strong> Change and Forestry. A<br />
Special Report <strong>of</strong> the Intergovernmental Panel on Climate Change<br />
(IPCC). Cambridge University Press, Cambridge.<br />
World Conservation Moni<strong>to</strong>ring Centre, 1992. Global Biodiversity: Status<br />
<strong>of</strong> the Earth’s Living Resources. Chapman & Hall, London.<br />
Yohe, G., Tol, R.S.J., 2002. Indica<strong>to</strong>rs for social and economic coping<br />
capacity—moving <strong>to</strong>ward a working definition <strong>of</strong> adaptive capacity.<br />
Global Environ. Change 12, 25–40.