The vulnerability of ecosystem services to land use change
The vulnerability of ecosystem services to land use change
The vulnerability of ecosystem services to land use change

Create successful ePaper yourself
Turn your PDF publications into a flip-book with our unique Google optimized e-Paper software.
74<br />
M.J. Metzger et al. / Agriculture, Ecosystems and Environment 114 (2006) 69–85<br />
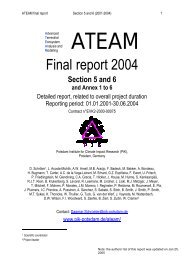
Fig. 4. Stratified <strong>ecosystem</strong> service supply for the <strong>ecosystem</strong> service indica<strong>to</strong>r farmer livelihood. <strong>The</strong> <strong>ecosystem</strong> service supply maps for ‘farmer livelihood’<br />
(Fig. 1) are stratified by the environmental strata (Fig. 3).<br />
make comparisons it is important that the stratification is<br />
preformed consistently. <strong>The</strong> reference value <strong>use</strong>d in this<br />
assessment is the highest <strong>ecosystem</strong> service value achieved<br />
in an environmental stratum. This measure can be compared<br />
<strong>to</strong> the concept <strong>of</strong> potential yield, defined by growth limiting<br />
environmental fac<strong>to</strong>rs (Van Ittersum et al., 2003). For a grid<br />
cell in a given EnS stratum, the fraction <strong>of</strong> the modelled<br />
<strong>ecosystem</strong> service provision relative <strong>to</strong> the highest achieved<br />
<strong>ecosystem</strong> service value in the region (ESref) is calculated,<br />
giving a unitless stratified value <strong>of</strong> the <strong>ecosystem</strong> service<br />
provision (ESstr) with a 0–1 range for the <strong>ecosystem</strong> service<br />
in the grid cell (cf. Eq. (4)). Thus ESref is unique for each<br />
<strong>ecosystem</strong> service indica<strong>to</strong>r, time slice, scenario, and EnS<br />
stratum:<br />
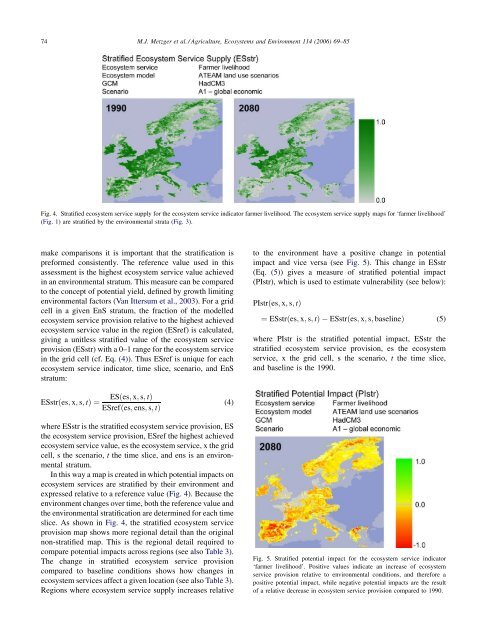
<strong>to</strong> the environment have a positive <strong>change</strong> in potential<br />
impact and vice versa (see Fig. 5). This <strong>change</strong> in ESstr<br />
(Eq. (5)) gives a measure <strong>of</strong> stratified potential impact<br />
(PIstr), which is <strong>use</strong>d <strong>to</strong> estimate <strong>vulnerability</strong> (see below):<br />
PIstrðes; x; s; tÞ<br />
¼ ESstrðes; x; s; tÞ ESstrðes; x; s; baselineÞ (5)<br />
where PIstr is the stratified potential impact, ESstr the<br />
stratified <strong>ecosystem</strong> service provision, es the <strong>ecosystem</strong><br />
service, x the grid cell, s the scenario, t the time slice,<br />
and baseline is the 1990.<br />
ESstrðes; x; s; tÞ ¼<br />
ESðes; x; s; tÞ<br />
ESrefðes; ens; s; tÞ<br />
(4)<br />
where ESstr is the stratified <strong>ecosystem</strong> service provision, ES<br />
the <strong>ecosystem</strong> service provision, ESref the highest achieved<br />
<strong>ecosystem</strong> service value, es the <strong>ecosystem</strong> service, x the grid<br />
cell, s the scenario, t the time slice, and ens is an environmental<br />
stratum.<br />
In this way a map is created in which potential impacts on<br />
<strong>ecosystem</strong> <strong>services</strong> are stratified by their environment and<br />
expressed relative <strong>to</strong> a reference value (Fig. 4). Beca<strong>use</strong> the<br />
environment <strong>change</strong>s over time, both the reference value and<br />
the environmental stratification are determined for each time<br />
slice. As shown in Fig. 4, the stratified <strong>ecosystem</strong> service<br />
provision map shows more regional detail than the original<br />
non-stratified map. This is the regional detail required <strong>to</strong><br />
compare potential impacts across regions (see also Table 3).<br />
<strong>The</strong> <strong>change</strong> in stratified <strong>ecosystem</strong> service provision<br />
compared <strong>to</strong> baseline conditions shows how <strong>change</strong>s in<br />
<strong>ecosystem</strong> <strong>services</strong> affect a given location (see also Table 3).<br />
Regions where <strong>ecosystem</strong> service supply increases relative<br />
Fig. 5. Stratified potential impact for the <strong>ecosystem</strong> service indica<strong>to</strong>r<br />
‘farmer livelihood’. Positive values indicate an increase <strong>of</strong> <strong>ecosystem</strong><br />
service provision relative <strong>to</strong> environmental conditions, and therefore a<br />
positive potential impact, while negative potential impacts are the result<br />
<strong>of</strong> a relative decrease in <strong>ecosystem</strong> service provision compared <strong>to</strong> 1990.