The vulnerability of ecosystem services to land use change
The vulnerability of ecosystem services to land use change
The vulnerability of ecosystem services to land use change

Create successful ePaper yourself
Turn your PDF publications into a flip-book with our unique Google optimized e-Paper software.
76<br />
M.J. Metzger et al. / Agriculture, Ecosystems and Environment 114 (2006) 69–85<br />
Fig. 6. Indica<strong>to</strong>r framework <strong>use</strong>d <strong>to</strong> develop the adaptive capacity model.<br />
account the limited empirical basis <strong>of</strong> the adaptive capacity<br />
index. It was therefore decided <strong>to</strong> create a visual<br />
combination <strong>of</strong> PIstr and AC without quantifying a specific<br />
relationship between them. <strong>The</strong> <strong>vulnerability</strong> maps illustrate<br />
which areas are vulnerable. For further analytical purposes<br />
the constituents <strong>of</strong> <strong>vulnerability</strong>, the <strong>change</strong>s in potential<br />
impact and the adaptive capacity index, are viewed<br />
separately.<br />
Trends in <strong>vulnerability</strong> follow the trend in PIstr: when<br />
<strong>ecosystem</strong> service supply decreases, humans relying on that<br />
particular <strong>ecosystem</strong> service become more vulnerable in that<br />
region. Alternatively, <strong>vulnerability</strong> decreases when <strong>ecosystem</strong><br />
service supply increases. Adaptive capacity lowers<br />
<strong>vulnerability</strong>. In regions with similar <strong>change</strong>s in potential<br />
impact, a region with a high AC will be less vulnerable than<br />
a region with a low AC. <strong>The</strong> PIstr determines the Hue,<br />
ranging from red (decreasing <strong>ecosystem</strong> service provision,<br />
PIstr = 1, highest negative potential impact) through<br />
yellow (no <strong>change</strong> in <strong>ecosystem</strong> service provision, PIstr = 0,<br />
no potential impact) <strong>to</strong> green (increase in <strong>ecosystem</strong> service<br />
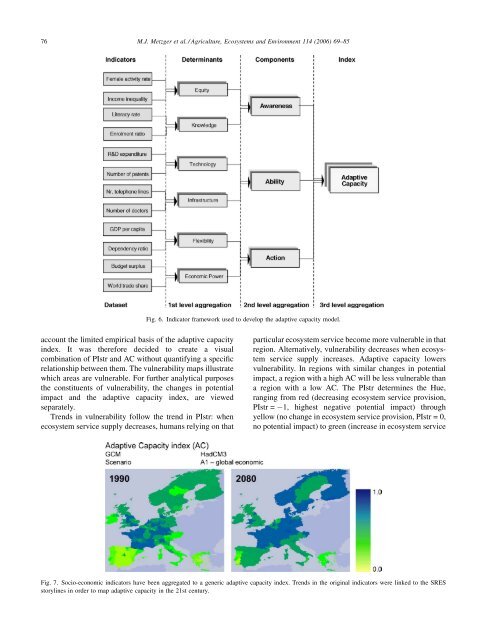
Fig. 7. Socio-economic indica<strong>to</strong>rs have been aggregated <strong>to</strong> a generic adaptive capacity index. Trends in the original indica<strong>to</strong>rs were linked <strong>to</strong> the SRES<br />
s<strong>to</strong>rylines in order <strong>to</strong> map adaptive capacity in the 21st century.