Bat Echolocation Researc h - Bat Conservation International
Bat Echolocation Researc h - Bat Conservation International
Bat Echolocation Researc h - Bat Conservation International

You also want an ePaper? Increase the reach of your titles
YUMPU automatically turns print PDFs into web optimized ePapers that Google loves.
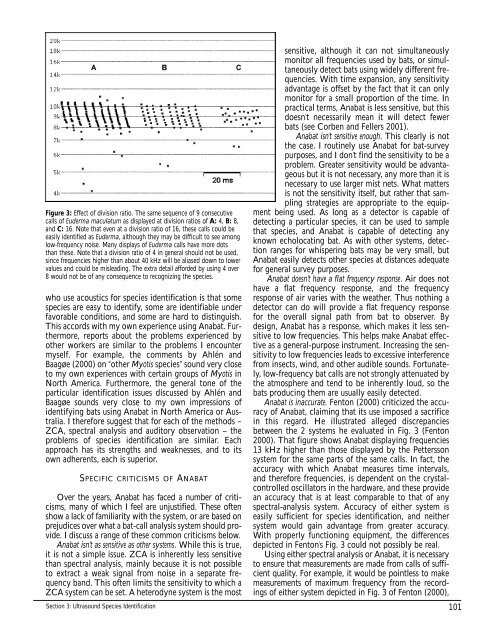
Figure 3: Effect of division ratio. The same sequence of 9 consecutive<br />
calls of Euderma maculatum as displayed at division ratios of A: 4, B: 8,<br />
and C: 16. Note that even at a division ratio of 16, these calls could be<br />
easily identified as Euderma, although they may be difficult to see among<br />
low-frequency noise. Many displays of Euderma calls have more dots<br />
than these. Note that a division ratio of 4 in general should not be used,<br />
since frequencies higher than about 40 kHz will be aliased down to lower<br />
values and could be misleading. The extra detail afforded by using 4 over<br />
8 would not be of any consequence to recognizing the species.<br />
who use acoustics for species identification is that some<br />
species are easy to identify, some are identifiable under<br />
favorable conditions, and some are hard to distinguish.<br />
This accords with my own experience using Anabat. Furthermore,<br />
reports about the problems experienced by<br />
other workers are similar to the problems I encounter<br />
myself. For example, the comments by Ahlén and<br />
Baagøe (2000) on “other Myotis species” sound very close<br />
to my own experiences with certain groups of Myotis in<br />
North America. Furthermore, the general tone of the<br />
particular identification issues discussed by Ahlén and<br />
Baagøe sounds very close to my own impressions of<br />
identifying bats using Anabat in North America or Australia.<br />
I therefore suggest that for each of the methods –<br />
ZCA, spectral analysis and auditory observation – the<br />
problems of species identification are similar. Each<br />
approach has its strengths and weaknesses, and to its<br />
own adherents, each is superior.<br />
SPECIFIC CRITICISMS OF ANABAT<br />
Over the years, Anabat has faced a number of criticisms,<br />
many of which I feel are unjustified. These often<br />
show a lack of familiarity with the system, or are based on<br />
prejudices over what a bat-call analysis system should provide.<br />
I discuss a range of these common criticisms below.<br />
Anabat isn’t as sensitive as other systems. While this is true,<br />
it is not a simple issue. ZCA is inherently less sensitive<br />
than spectral analysis, mainly because it is not possible<br />
to extract a weak signal from noise in a separate frequency<br />
band. This often limits the sensitivity to which a<br />
ZCA system can be set. A heterodyne system is the most<br />
Section 3: Ultrasound Species Identification<br />
sensitive, although it can not simultaneously<br />
monitor all frequencies used by bats, or simultaneously<br />
detect bats using widely different frequencies.<br />
With time expansion, any sensitivity<br />
advantage is offset by the fact that it can only<br />
monitor for a small proportion of the time. In<br />
practical terms, Anabat is less sensitive, but this<br />
doesn’t necessarily mean it will detect fewer<br />
bats (see Corben and Fellers 2001).<br />
Anabat isn’t sensitive enough. This clearly is not<br />
the case. I routinely use Anabat for bat-survey<br />
purposes, and I don’t find the sensitivity to be a<br />
problem. Greater sensitivity would be advantageous<br />
but it is not necessary, any more than it is<br />
necessary to use larger mist nets. What matters<br />
is not the sensitivity itself, but rather that sampling<br />
strategies are appropriate to the equipment<br />
being used. As long as a detector is capable of<br />
detecting a particular species, it can be used to sample<br />
that species, and Anabat is capable of detecting any<br />
known echolocating bat. As with other systems, detection<br />
ranges for whispering bats may be very small, but<br />
Anabat easily detects other species at distances adequate<br />
for general survey purposes.<br />
Anabat doesn’t have a flat frequency response. Air does not<br />
have a flat frequency response, and the frequency<br />
response of air varies with the weather. Thus nothing a<br />
detector can do will provide a flat frequency response<br />
for the overall signal path from bat to observer. By<br />
design, Anabat has a response, which makes it less sensitive<br />
to low frequencies. This helps make Anabat effective<br />
as a general-purpose instrument. Increasing the sensitivity<br />
to low frequencies leads to excessive interference<br />
from insects, wind, and other audible sounds. Fortunately,<br />
low-frequency bat calls are not strongly attenuated by<br />
the atmosphere and tend to be inherently loud, so the<br />
bats producing them are usually easily detected.<br />
Anabat is inaccurate. Fenton (2000) criticized the accuracy<br />
of Anabat, claiming that its use imposed a sacrifice<br />
in this regard. He illustrated alleged discrepancies<br />
between the 2 systems he evaluated in Fig. 3 (Fenton<br />
2000). That figure shows Anabat displaying frequencies<br />
13 kHz higher than those displayed by the Pettersson<br />
system for the same parts of the same calls. In fact, the<br />
accuracy with which Anabat measures time intervals,<br />
and therefore frequencies, is dependent on the crystalcontrolled<br />
oscillators in the hardware, and these provide<br />
an accuracy that is at least comparable to that of any<br />
spectral-analysis system. Accuracy of either system is<br />
easily sufficient for species identification, and neither<br />
system would gain advantage from greater accuracy.<br />
With properly functioning equipment, the differences<br />
depicted in Fenton’s Fig. 3 could not possibly be real.<br />
Using either spectral analysis or Anabat, it is necessary<br />
to ensure that measurements are made from calls of sufficient<br />
quality. For example, it would be pointless to make<br />
measurements of maximum frequency from the recordings<br />
of either system depicted in Fig. 3 of Fenton (2000),<br />
101