Bat Echolocation Researc h - Bat Conservation International
Bat Echolocation Researc h - Bat Conservation International
Bat Echolocation Researc h - Bat Conservation International

Create successful ePaper yourself
Turn your PDF publications into a flip-book with our unique Google optimized e-Paper software.
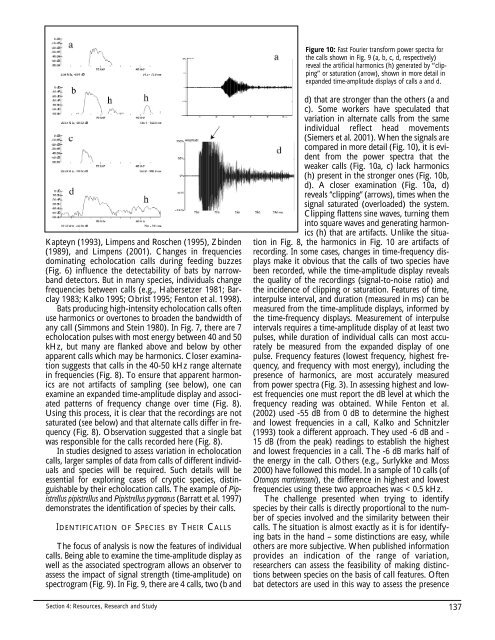
Figure 10: Fast Fourier transform power spectra for<br />
the calls shown in Fig. 9 (a, b, c, d, respectively)<br />
reveal the artificial harmonics (h) generated by “clipping”<br />
or saturation (arrow), shown in more detail in<br />
expanded time-amplitude displays of calls a and d.<br />
Kapteyn (1993), Limpens and Roschen (1995), Zbinden<br />
(1989), and Limpens (2001). Changes in frequencies<br />
dominating echolocation calls during feeding buzzes<br />
(Fig. 6) influence the detectability of bats by narrowband<br />
detectors. But in many species, individuals change<br />
frequencies between calls (e.g., Habersetzer 1981; Barclay<br />
1983; Kalko 1995; Obrist 1995; Fenton et al. 1998).<br />
<strong>Bat</strong>s producing high-intensity echolocation calls often<br />
use harmonics or overtones to broaden the bandwidth of<br />
any call (Simmons and Stein 1980). In Fig. 7, there are 7<br />
echolocation pulses with most energy between 40 and 50<br />
kHz, but many are flanked above and below by other<br />
apparent calls which may be harmonics. Closer examination<br />
suggests that calls in the 40-50 kHz range alternate<br />
in frequencies (Fig. 8). To ensure that apparent harmonics<br />
are not artifacts of sampling (see below), one can<br />
examine an expanded time-amplitude display and associated<br />
patterns of frequency change over time (Fig. 8).<br />
Using this process, it is clear that the recordings are not<br />
saturated (see below) and that alternate calls differ in frequency<br />
(Fig. 8). Observation suggested that a single bat<br />
was responsible for the calls recorded here (Fig. 8).<br />
In studies designed to assess variation in echolocation<br />
calls, larger samples of data from calls of different individuals<br />
and species will be required. Such details will be<br />
essential for exploring cases of cryptic species, distinguishable<br />
by their echolocation calls. The example of Pipistrellus<br />
pipistrellus and Pipistrellus pygmaeus (Barratt et al. 1997)<br />
demonstrates the identification of species by their calls.<br />
IDENTIFICATION OF SPECIES BY THEIR CALLS<br />
The focus of analysis is now the features of individual<br />
calls. Being able to examine the time-amplitude display as<br />
well as the associated spectrogram allows an observer to<br />
assess the impact of signal strength (time-amplitude) on<br />
spectrogram (Fig. 9). In Fig. 9, there are 4 calls, two (b and<br />
Section 4: Resources, <strong>Researc</strong>h and Study<br />
d) that are stronger than the others (a and<br />
c). Some workers have speculated that<br />
variation in alternate calls from the same<br />
individual reflect head movements<br />
(Siemers et al. 2001). When the signals are<br />
compared in more detail (Fig. 10), it is evident<br />
from the power spectra that the<br />
weaker calls (Fig. 10a, c) lack harmonics<br />
(h) present in the stronger ones (Fig. 10b,<br />
d). A closer examination (Fig. 10a, d)<br />
reveals “clipping” (arrows), times when the<br />
signal saturated (overloaded) the system.<br />
Clipping flattens sine waves, turning them<br />
into square waves and generating harmonics<br />
(h) that are artifacts. Unlike the situation<br />
in Fig. 8, the harmonics in Fig. 10 are artifacts of<br />
recording. In some cases, changes in time-frequency displays<br />
make it obvious that the calls of two species have<br />
been recorded, while the time-amplitude display reveals<br />
the quality of the recordings (signal-to-noise ratio) and<br />
the incidence of clipping or saturation. Features of time,<br />
interpulse interval, and duration (measured in ms) can be<br />
measured from the time-amplitude displays, informed by<br />
the time-frequency displays. Measurement of interpulse<br />
intervals requires a time-amplitude display of at least two<br />
pulses, while duration of individual calls can most accurately<br />
be measured from the expanded display of one<br />
pulse. Frequency features (lowest frequency, highest frequency,<br />
and frequency with most energy), including the<br />
presence of harmonics, are most accurately measured<br />
from power spectra (Fig. 3). In assessing highest and lowest<br />
frequencies one must report the dB level at which the<br />
frequency reading was obtained. While Fenton et al.<br />
(2002) used -55 dB from 0 dB to determine the highest<br />
and lowest frequencies in a call, Kalko and Schnitzler<br />
(1993) took a different approach. They used -6 dB and -<br />
15 dB (from the peak) readings to establish the highest<br />
and lowest frequencies in a call. The -6 dB marks half of<br />
the energy in the call. Others (e.g., Surlykke and Moss<br />
2000) have followed this model. In a sample of 10 calls (of<br />
Otomops martiensseni), the difference in highest and lowest<br />
frequencies using these two approaches was < 0.5 kHz.<br />
The challenge presented when trying to identify<br />
species by their calls is directly proportional to the number<br />
of species involved and the similarity between their<br />
calls. The situation is almost exactly as it is for identifying<br />
bats in the hand – some distinctions are easy, while<br />
others are more subjective. When published information<br />
provides an indication of the range of variation,<br />
researchers can assess the feasibility of making distinctions<br />
between species on the basis of call features. Often<br />
bat detectors are used in this way to assess the presence<br />
137