Bat Echolocation Researc h - Bat Conservation International
Bat Echolocation Researc h - Bat Conservation International
Bat Echolocation Researc h - Bat Conservation International

Create successful ePaper yourself
Turn your PDF publications into a flip-book with our unique Google optimized e-Paper software.
74<br />
QUANTIFYING SOUND FEATURES<br />
To quantify characteristics of sounds heard directly<br />
through detectors or from recordings, it is necessary to<br />
make measurements. The following remarks are important<br />
in the context of taking measurements to identify<br />
species.<br />
With a heterodyne detector, one can only turn a<br />
knob and read a scale or display to assess frequency. The<br />
values are not saved. This means that it is difficult to<br />
check afterwards if the tuning was correctly made. Also,<br />
some very common bat sounds with near-CF endings<br />
(QCF-type), may have a broad band of frequencies (5<br />
kHz or more) where the heterodyned signal sounds<br />
exactly the same. Indeed, some observers who use heterodyne<br />
argue about bats being 1 or 2 kHz too low or<br />
high! Added to this uncertainty is the Doppler effect<br />
that may change the frequency by 1 or 2 kHz.<br />
With a time-expansion system, the CF and near-CFfrequencies<br />
can be heard and perceived immediately<br />
after recording. Workers with absolute pitch abilities can<br />
differentiate frequencies within a few kHz, that is, with<br />
better precision than with heterodyne tuning. With a<br />
sound-analysis program, the sounds can be inspected<br />
and measured. Even with the best recordings and diagrams,<br />
however, there are some uncertainties that must<br />
be kept in mind when characterizing species and making<br />
comparisons.<br />
Some uncertainties are due to changes in sound that<br />
occur as calls travel from the bat to the detector, or<br />
changes produced by the instruments themselves. Pulse<br />
length or maximum frequency is often variable because<br />
the first low-intensity part of the pulse can easily be lost<br />
in the recording. These measurements are seldom of<br />
diagnostic value. The frequency at maximum amplitude,<br />
the power spectrum peak (whole or part of pulse), frequency<br />
at the QCF-ending, and the so-called best-listening<br />
frequency (using heterodyne) are examples of<br />
repeatable measurements. Biologically, the most significant<br />
frequency in such pulses is perhaps the part that<br />
creates the most powerful echoes, which are easily seen<br />
in some sonograms. This frequency is usually the last<br />
strong part of the QCF-ending and typically corresponds<br />
to the best-listening frequency in heterodyne<br />
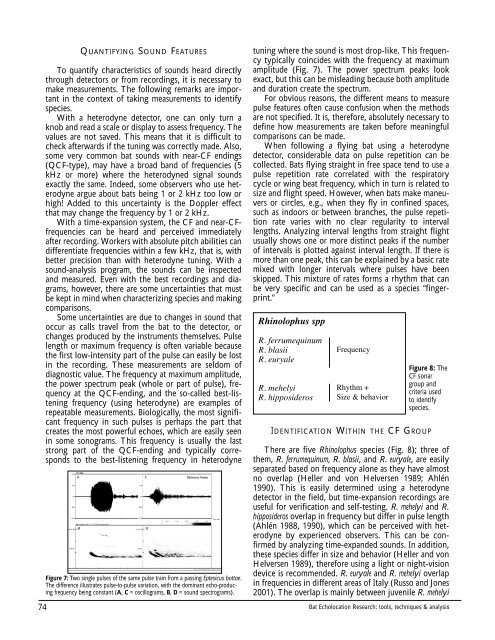
Figure 7: Two single pulses of the same pulse train from a passing Eptesicus bottae.<br />
The difference illustrates pulse-to-pulse variation, with the dominant echo-producing<br />
frequency being constant (A, C = oscillograms, B, D = sound spectrograms).<br />
tuning where the sound is most drop-like. This frequency<br />
typically coincides with the frequency at maximum<br />
amplitude (Fig. 7). The power spectrum peaks look<br />
exact, but this can be misleading because both amplitude<br />
and duration create the spectrum.<br />
For obvious reasons, the different means to measure<br />
pulse features often cause confusion when the methods<br />
are not specified. It is, therefore, absolutely necessary to<br />
define how measurements are taken before meaningful<br />
comparisons can be made.<br />
When following a flying bat using a heterodyne<br />
detector, considerable data on pulse repetition can be<br />
collected. <strong>Bat</strong>s flying straight in free space tend to use a<br />
pulse repetition rate correlated with the respiratory<br />
cycle or wing beat frequency, which in turn is related to<br />
size and flight speed. However, when bats make maneuvers<br />
or circles, e.g., when they fly in confined spaces,<br />
such as indoors or between branches, the pulse repetition<br />
rate varies with no clear regularity to interval<br />
lengths. Analyzing interval lengths from straight flight<br />
usually shows one or more distinct peaks if the number<br />
of intervals is plotted against interval length. If there is<br />
more than one peak, this can be explained by a basic rate<br />
mixed with longer intervals where pulses have been<br />
skipped. This mixture of rates forms a rhythm that can<br />
be very specific and can be used as a species “fingerprint.”<br />
Rhinolophus spp<br />
R. ferrumequinum<br />
R. blasii<br />
R. euryale<br />
R. mehelyi<br />
R. hipposideros<br />
Frequency<br />
Rhythm +<br />
Size & behavior<br />
Figure 8: The<br />
CF sonar<br />
group and<br />
criteria used<br />
to identify<br />
species.<br />
IDENTIFICATION WITHIN THE CF GROUP<br />
There are five Rhinolophus species (Fig. 8); three of<br />
them, R. ferrumequinum, R. blasii, and R. euryale, are easily<br />
separated based on frequency alone as they have almost<br />
no overlap (Heller and von Helversen 1989; Ahlén<br />
1990). This is easily determined using a heterodyne<br />
detector in the field, but time-expansion recordings are<br />
useful for verification and self-testing. R. mehelyi and R.<br />
hipposideros overlap in frequency but differ in pulse length<br />
(Ahlén 1988, 1990), which can be perceived with heterodyne<br />
by experienced observers. This can be confirmed<br />
by analyzing time-expanded sounds. In addition,<br />
these species differ in size and behavior (Heller and von<br />
Helversen 1989), therefore using a light or night-vision<br />
device is recommended. R. euryale and R. mehelyi overlap<br />
in frequencies in different areas of Italy (Russo and Jones<br />
2001). The overlap is mainly between juvenile R. mehelyi<br />
<strong>Bat</strong> <strong>Echolocation</strong> <strong>Researc</strong>h: tools, techniques & analysis