Bat Echolocation Researc h - Bat Conservation International
Bat Echolocation Researc h - Bat Conservation International
Bat Echolocation Researc h - Bat Conservation International

You also want an ePaper? Increase the reach of your titles
YUMPU automatically turns print PDFs into web optimized ePapers that Google loves.
A<br />
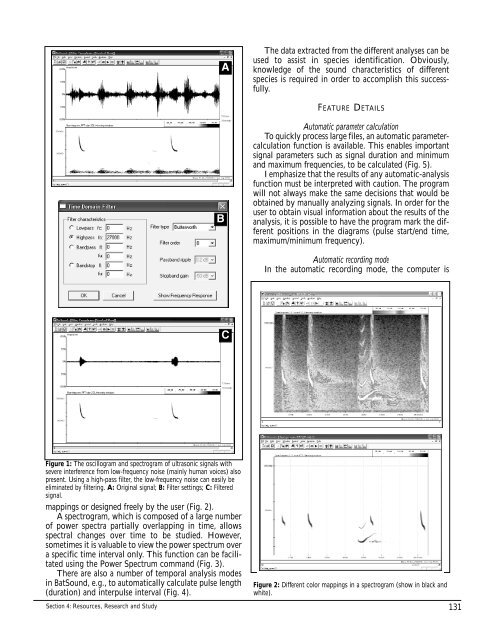
The data extracted from the different analyses can be<br />
used to assist in species identification. Obviously,<br />
knowledge of the sound characteristics of different<br />
species is required in order to accomplish this successfully.<br />
FEATURE DETAILS<br />
B<br />
Automatic parameter calculation<br />
To quickly process large files, an automatic parametercalculation<br />
function is available. This enables important<br />
signal parameters such as signal duration and minimum<br />
and maximum frequencies, to be calculated (Fig. 5).<br />
I emphasize that the results of any automatic-analysis<br />
function must be interpreted with caution. The program<br />
will not always make the same decisions that would be<br />
obtained by manually analyzing signals. In order for the<br />
user to obtain visual information about the results of the<br />
analysis, it is possible to have the program mark the different<br />
positions in the diagrams (pulse start/end time,<br />
maximum/minimum frequency).<br />
Automatic recording mode<br />
In the automatic recording mode, the computer is<br />
C<br />
Figure 1: The oscillogram and spectrogram of ultrasonic signals with<br />
severe interference from low-frequency noise (mainly human voices) also<br />
present. Using a high-pass filter, the low-frequency noise can easily be<br />
eliminated by filtering. A: Original signal; B: Filter settings; C: Filtered<br />
signal.<br />
mappings or designed freely by the user (Fig. 2).<br />
A spectrogram, which is composed of a large number<br />
of power spectra partially overlapping in time, allows<br />
spectral changes over time to be studied. However,<br />
sometimes it is valuable to view the power spectrum over<br />
a specific time interval only. This function can be facilitated<br />
using the Power Spectrum command (Fig. 3).<br />
There are also a number of temporal analysis modes<br />
in <strong>Bat</strong>Sound, e.g., to automatically calculate pulse length<br />
(duration) and interpulse interval (Fig. 4).<br />
Section 4: Resources, <strong>Researc</strong>h and Study<br />
Figure 2: Different color mappings in a spectrogram (show in black and<br />
white).<br />
131