Bat Echolocation Researc h - Bat Conservation International
Bat Echolocation Researc h - Bat Conservation International
Bat Echolocation Researc h - Bat Conservation International

Create successful ePaper yourself
Turn your PDF publications into a flip-book with our unique Google optimized e-Paper software.
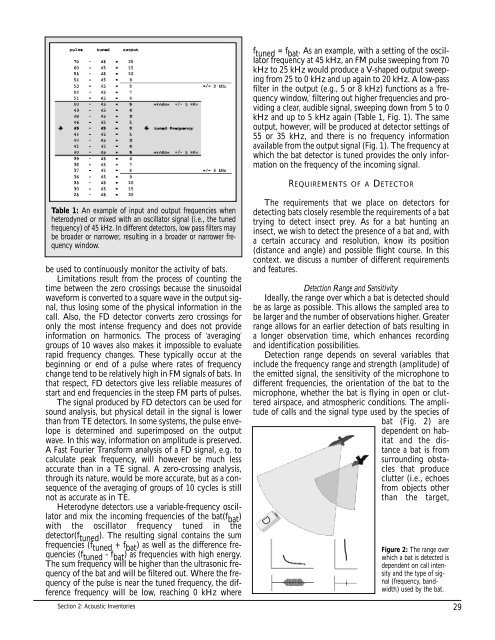
f tuned = f bat . As an example, with a setting of the oscillator<br />
frequency at 45 kHz, an FM pulse sweeping from 70<br />
kHz to 25 kHz would produce a V-shaped output sweeping<br />
from 25 to 0 kHz and up again to 20 kHz. A low-pass<br />
filter in the output (e.g., 5 or 8 kHz) functions as a ‘frequency<br />
window,’ filtering out higher frequencies and providing<br />
a clear, audible signal, sweeping down from 5 to 0<br />
kHz and up to 5 kHz again (Table 1, Fig. 1). The same<br />
output, however, will be produced at detector settings of<br />
55 or 35 kHz, and there is no frequency information<br />
available from the output signal (Fig. 1). The frequency at<br />
which the bat detector is tuned provides the only information<br />
on the frequency of the incoming signal.<br />
REQUIREMENTS OF A DETECTOR<br />
Table 1: An example of input and output frequencies when<br />
heterodyned or mixed with an oscillator signal (i.e., the tuned<br />
frequency) of 45 kHz. In different detectors, low pass filters may<br />
be broader or narrower, resulting in a broader or narrower frequency<br />
window.<br />
be used to continuously monitor the activity of bats.<br />
Limitations result from the process of counting the<br />
time between the zero crossings because the sinusoidal<br />
waveform is converted to a square wave in the output signal,<br />
thus losing some of the physical information in the<br />
call. Also, the FD detector converts zero crossings for<br />
only the most intense frequency and does not provide<br />
information on harmonics. The process of ‘averaging’<br />
groups of 10 waves also makes it impossible to evaluate<br />
rapid frequency changes. These typically occur at the<br />
beginning or end of a pulse where rates of frequency<br />
change tend to be relatively high in FM signals of bats. In<br />
that respect, FD detectors give less reliable measures of<br />
start and end frequencies in the steep FM parts of pulses.<br />
The signal produced by FD detectors can be used for<br />
sound analysis, but physical detail in the signal is lower<br />
than from TE detectors. In some systems, the pulse envelope<br />
is determined and superimposed on the output<br />
wave. In this way, information on amplitude is preserved.<br />
A Fast Fourier Transform analysis of a FD signal, e.g. to<br />
calculate peak frequency, will however be much less<br />
accurate than in a TE signal. A zero-crossing analysis,<br />
through its nature, would be more accurate, but as a consequence<br />
of the averaging of groups of 10 cycles is still<br />
not as accurate as in TE.<br />
Heterodyne detectors use a variable-frequency oscillator<br />
and mix the incoming frequencies of the bat(f bat )<br />
with the oscillator frequency tuned in the<br />
detector(f tuned ). The resulting signal contains the sum<br />
frequencies (f tuned + f bat ) as well as the difference frequencies<br />
(f tuned - f bat ) as frequencies with high energy.<br />
The sum frequency will be higher than the ultrasonic frequency<br />
of the bat and will be filtered out. Where the frequency<br />
of the pulse is near the tuned frequency, the difference<br />
frequency will be low, reaching 0 kHz where<br />
Section 2: Acoustic Inventories<br />
The requirements that we place on detectors for<br />
detecting bats closely resemble the requirements of a bat<br />
trying to detect insect prey. As for a bat hunting an<br />
insect, we wish to detect the presence of a bat and, with<br />
a certain accuracy and resolution, know its position<br />
(distance and angle) and possible flight course. In this<br />
context. we discuss a number of different requirements<br />
and features.<br />
Detection Range and Sensitivity<br />
Ideally, the range over which a bat is detected should<br />
be as large as possible. This allows the sampled area to<br />
be larger and the number of observations higher. Greater<br />
range allows for an earlier detection of bats resulting in<br />
a longer observation time, which enhances recording<br />
and identification possibilities.<br />
Detection range depends on several variables that<br />
include the frequency range and strength (amplitude) of<br />
the emitted signal, the sensitivity of the microphone to<br />
different frequencies, the orientation of the bat to the<br />
microphone, whether the bat is flying in open or cluttered<br />
airspace, and atmospheric conditions. The amplitude<br />
of calls and the signal type used by the species of<br />
bat (Fig. 2) are<br />
dependent on habitat<br />
and the distance<br />
a bat is from<br />
surrounding obstacles<br />
that produce<br />
clutter (i.e., echoes<br />
from objects other<br />
than the target,<br />
Figure 2: The range over<br />
which a bat is detected is<br />
dependent on call intensity<br />
and the type of signal<br />
(frequency, bandwidth)<br />
used by the bat.<br />
29