Download - Platinum Metals Review
Download - Platinum Metals Review
Download - Platinum Metals Review

Create successful ePaper yourself
Turn your PDF publications into a flip-book with our unique Google optimized e-Paper software.
doi:10.1595/147106711X554008<br />
•<strong>Platinum</strong> <strong>Metals</strong> Rev., 2011, 55, (2)•<br />
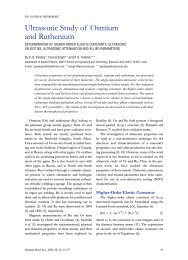
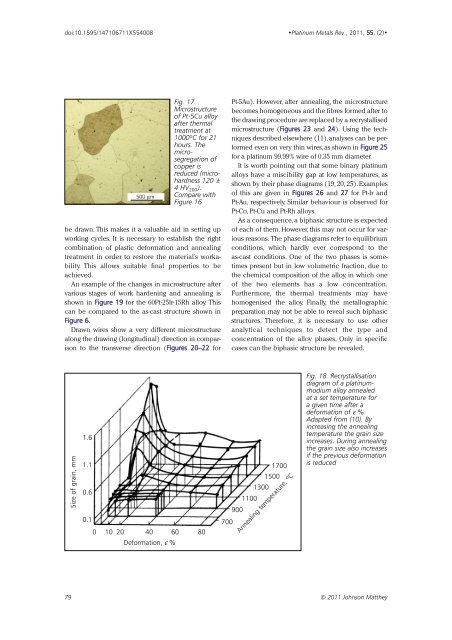
500 µm<br />
Fig. 17.<br />
Microstructure<br />
of Pt-5Cu alloy<br />
after thermal<br />
treatment at<br />
1000ºC for 21<br />
hours. The<br />
microsegregation<br />
of<br />
copper is<br />
reduced (microhardness<br />
120 ±<br />
4 HV 200 ).<br />
Compare with<br />
Figure 16<br />
be drawn. This makes it a valuable aid in setting up<br />
working cycles. It is necessary to establish the right<br />
combination of plastic deformation and annealing<br />
treatment in order to restore the material’s workability.<br />
This allows suitable final properties to be<br />
achieved.<br />
An example of the changes in microstructure after<br />
various stages of work hardening and annealing is<br />
shown in Figure 19 for the 60Pt-25Ir-15Rh alloy. This<br />
can be compared to the as-cast structure shown in<br />
Figure 6.<br />
Drawn wires show a very different microstructure<br />
along the drawing (longitudinal) direction in comparison<br />
to the transverse direction (Figures 20–22 for<br />
Pt-5Au). However, after annealing, the microstructure<br />
becomes homogeneous and the fibres formed after to<br />
the drawing procedure are replaced by a recrystallised<br />
microstructure (Figures 23 and 24). Using the techniques<br />
described elsewhere (11),analyses can be performed<br />
even on very thin wires,as shown in Figure 25<br />
for a platinum 99.99% wire of 0.35 mm diameter.<br />
It is worth pointing out that some binary platinum<br />
alloys have a miscibility gap at low temperatures, as<br />
shown by their phase diagrams (19, 20, 25). Examples<br />
of this are given in Figures 26 and 27 for Pt-Ir and<br />
Pt-Au, respectively. Similar behaviour is observed for<br />
Pt-Co, Pt-Cu and Pt-Rh alloys.<br />
As a consequence, a biphasic structure is expected<br />
of each of them. However, this may not occur for various<br />
reasons. The phase diagrams refer to equilibrium<br />
conditions, which hardly ever correspond to the<br />
as-cast conditions. One of the two phases is sometimes<br />
present but in low volumetric fraction, due to<br />
the chemical composition of the alloy, in which one<br />
of the two elements has a low concentration.<br />
Furthermore, the thermal treatments may have<br />
homogenised the alloy. Finally, the metallographic<br />
preparation may not be able to reveal such biphasic<br />
structures. Therefore, it is necessary to use other<br />
analytical techniques to detect the type and<br />
concentration of the alloy phases. Only in specific<br />
cases can the biphasic structure be revealed.<br />
Size of grain, mm<br />
1.6<br />
1.1<br />
0.6<br />
0.1<br />
0 10 20 40 60 80<br />
Deformation, ε %<br />
700<br />
900<br />
1100<br />
1300<br />
1700<br />
1500<br />
Annealing temperature, ºC<br />
Fig. 18. Recrystallisation<br />
diagram of a platinumrhodium<br />
alloy annealed<br />
at a set temperature for<br />
a given time after a<br />
deformation of ε %.<br />
Adapted from (10). By<br />
increasing the annealing<br />
temperature the grain size<br />
increases. During annealing<br />
the grain size also increases<br />
if the previous deformation<br />
is reduced<br />
79 © 2011 Johnson Matthey