Download - polytec
Download - polytec
Download - polytec

Create successful ePaper yourself
Turn your PDF publications into a flip-book with our unique Google optimized e-Paper software.
POLYTEC 2012 Group Management Report<br />
FinancIAl ReSUlt<br />
The financial result in 2012 amounted to EUR -0.9 million compared<br />
to EUR -3.1 million in the previous year.<br />
In the year under review, the marked decline in financial expenses<br />
by more than 60% or EUR 2.3 million to EUR –1.1 million was mainly<br />
attributable to interest income resulting from the investment of<br />
available liquidity over the course of 2012 in addition to an overall<br />
lower usage of bank loans. Income from other investments includes<br />
dividends from the POLYTEC Immobilien Group of EUR 0.1 million.<br />
Including deferred tax effects, the Group’s effective tax rate<br />
amounted to 16.8% in 2012 and was therefore considerably lower<br />
than the full taxation of income due to the conservative measurement<br />
of tax losses carried forward in previous years.<br />
Net profit amounted to EUR 21.7 million in the year under review.<br />
This corresponds to earnings per share of EUR 0.97.<br />
GroUP Key BALANCE Sheet AND FINANCIAL FIGURES<br />
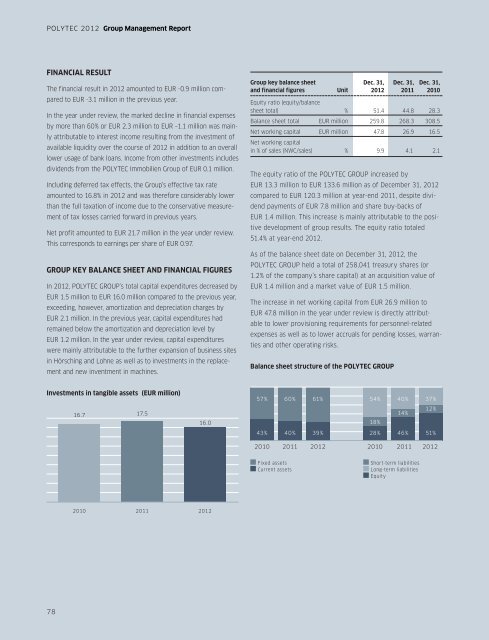
In 2012, POLYTEC GROUP’s total capital expenditures decreased by<br />
EUR 1.5 million to EUR 16.0 million compared to the previous year,<br />
exceeding, however, amortization and depreciation charges by<br />
EUR 2.1 million. In the previous year, capital expenditures had<br />
remained below the amortization and depreciation level by<br />
EUR 1.2 million. In the year under review, capital expenditures<br />
were mainly attributable to the further expansion of business sites<br />
in Hörsching and Lohne as well as to investments in the replacement<br />
and new inventment in machines.<br />
Group key balance sheet Dec. 31, Dec. 31, Dec. 31,<br />
and financial figures Unit 2012 2011 2010<br />
Equity ratio (equity/balance<br />
sheet total) % 51.4 44.8 28.3<br />
Balance sheet total EUR million 259.8 268.3 308.5<br />
Net working capital EUR million 47.8 26.9 16.5<br />
Net working capital<br />
in % of sales (NWC/sales) % 9.9 4.1 2.1<br />
The equity ratio of the POLYTEC GROUP increased by<br />
EUR 13.3 million to EUR 133.6 million as of December 31, 2012<br />
compared to EUR 120.3 million at year-end 2011, despite dividend<br />
payments of EUR 7.8 million and share buy-backs of<br />
EUR 1.4 million. This increase is mainly attributable to the positive<br />
development of group results. The equity ratio totaled<br />
51.4% at year-end 2012.<br />
As of the balance sheet date on December 31, 2012, the<br />
POLYTEC GROUP held a total of 258,041 treasury shares (or<br />
1.2% of the company’s share capital) at an acquisition value of<br />
EUR 1.4 million and a market value of EUR 1.5 million.<br />
The increase in net working capital from EUR 26.9 million to<br />
EUR 47.8 million in the year under review is directly attributable<br />
to lower provisioning requirements for personnel-related<br />
expenses as well as to lower accruals for pending losses, warranties<br />
and other operating risks.<br />
Balance sheet structure of the POLYTEC GroUP<br />
Investments in tangible assets (EUR million)<br />
57% 60%<br />
61%<br />
54%<br />
40%<br />
37%<br />
16.7<br />
17.5<br />
16.0<br />
18%<br />
14%<br />
12%<br />
43% 40% 39%<br />
28%<br />
46%<br />
51%<br />
2010<br />
2011<br />
2012<br />
2010<br />
2011<br />
2012<br />
Fixed assets<br />
Current assets<br />
Short-term liabilities<br />
Long-term liabilities<br />
Equity<br />
2010<br />
2011<br />
2012<br />
78