Analyst Report KBC Securities - Quest for Growth
Analyst Report KBC Securities - Quest for Growth
Analyst Report KBC Securities - Quest for Growth

You also want an ePaper? Increase the reach of your titles
YUMPU automatically turns print PDFs into web optimized ePapers that Google loves.
MORNING NOTE<br />
5 July 2012<br />
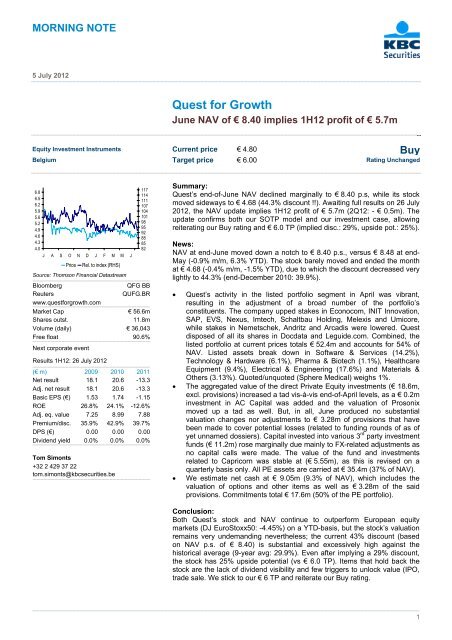
<strong>Quest</strong> <strong>for</strong> <strong>Growth</strong><br />
June NAV of € 8.40 implies 1H12 profit of € 5.7m<br />
Equity Investment Instruments Current price € 4.80 Buy<br />
Belgium Target price € 6.00 Rating Unchanged<br />
6.8<br />
6.5<br />
6.2<br />
5.9<br />
5.6<br />
5.2<br />
4.9<br />
4.6<br />
4.3<br />
4.0<br />
J A S O N D J F M M J<br />
Price<br />
Rel. to index (RHS)<br />
Source: Thomson Financial Datastream<br />
Bloomberg<br />
QFG BB<br />
Reuters<br />
QUFG.BR<br />
www.quest<strong>for</strong>growth.com<br />
Market Cap € 56.6m<br />
Shares outst. 11.8m<br />
Volume (daily) € 36,043<br />
Free float 90.6%<br />
Next corporate event<br />
Results 1H12: 26 July 2012<br />
(€ m) 2009 2010 2011<br />
Net result 18.1 20.6 -13.3<br />
Adj. net result 18.1 20.6 -13.3<br />
Basic EPS (€) 1.53 1.74 -1.15<br />
ROE 26.8% 24.1% -12.6%<br />
Adj. eq. value 7.25 8.99 7.88<br />
Premium/disc. 35.9% 42.9% 39.7%<br />
DPS (€) 0.00 0.00 0.00<br />
Dividend yield 0.0% 0.0% 0.0%<br />
Tom Simonts<br />
+32 2 429 37 22<br />
tom.simonts@kbcsecurities.be<br />
117<br />
114<br />
111<br />
107<br />
104<br />
101<br />
98<br />
95<br />
92<br />
88<br />
85<br />
82<br />
Summary:<br />
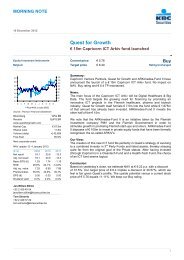
<strong>Quest</strong>’s end-of-June NAV declined marginally to € 8.40 p.s, while its stock<br />
moved sideways to € 4.68 (44.3% discount !!). Awaiting full results on 26 July<br />
2012, the NAV update implies 1H12 profit of € 5.7m (2Q12: - € 0.5m). The<br />
update confirms both our SOTP model and our investment case, allowing<br />
reiterating our Buy rating and € 6.0 TP (implied disc.: 29%, upside pot.: 25%).<br />
News:<br />
NAV at end-June moved down a notch to € 8.40 p.s., versus € 8.48 at end-<br />
May (-0.9% m/m, 6.3% YTD). The stock barely moved and ended the month<br />
at € 4.68 (-0.4% m/m, -1.5% YTD), due to which the discount decreased very<br />
lightly to 44.3% (end-December 2010: 39.9%).<br />
• <strong>Quest</strong>’s activity in the listed portfolio segment in April was vibrant,<br />
resulting in the adjustment of a broad number of the portfolio’s<br />
constituents. The company upped stakes in Econocom, INIT Innovation,<br />
SAP, EVS, Nexus, Imtech, Schaltbau Holding, Melexis and Umicore,<br />
while stakes in Nemetschek, Andritz and Arcadis were lowered. <strong>Quest</strong><br />
disposed of all its shares in Docdata and Leguide.com. Combined, the<br />
listed portfolio at current prices totals € 52.4m and accounts <strong>for</strong> 54% of<br />
NAV. Listed assets break down in Software & Services (14.2%),<br />
Technology & Hardware (6.1%), Pharma & Biotech (1.1%), Healthcare<br />
Equipment (9.4%), Electrical & Engineering (17.6%) and Materials &<br />
Others (3.13%). Quoted/unquoted (Sphere Medical) weighs 1%.<br />
• The aggregated value of the direct Private Equity investments (€ 18.6m,<br />
excl. provisions) increased a tad vis-à-vis end-of-April levels, as a € 0.2m<br />
investment in AC Capital was added and the valuation of Prosonix<br />
moved up a tad as well. But, in all, June produced no substantial<br />
valuation changes nor adjustments to € 3.28m of provisions that have<br />
been made to cover potential losses (related to funding rounds of as of<br />
yet unnamed dossiers). Capital invested into various 3 rd party investment<br />
funds (€ 11.2m) rose marginally due mainly to FX-related adjustments as<br />
no capital calls were made. The value of the fund and investments<br />
related to Capricorn was stable at (€ 5.55m), as this is revised on a<br />
quarterly basis only. All PE assets are carried at € 35.4m (37% of NAV).<br />
• We estimate net cash at € 9.05m (9.3% of NAV), which includes the<br />
valuation of options and other items as well as € 3.28m of the said<br />
provisions. Commitments total € 17.6m (50% of the PE portfolio).<br />
Conclusion:<br />
Both <strong>Quest</strong>’s stock and NAV continue to outper<strong>for</strong>m European equity<br />
markets (DJ EuroStoxx50: -4.45%) on a YTD-basis, but the stock’s valuation<br />
remains very undemanding nevertheless; the current 43% discount (based<br />
on NAV p.s. of € 8.40) is substantial and excessively high against the<br />
historical average (9-year avg: 29.9%). Even after implying a 29% discount,<br />
the stock has 25% upside potential (vs € 6.0 TP). Items that hold back the<br />
stock are the lack of dividend visibility and few triggers to unlock value (IPO,<br />
trade sale. We stick to our € 6 TP and reiterate our Buy rating.<br />
DO NOT REMOVE THIS LINE!<br />
1
MORNING NOTE<br />
5 July 2012<br />
SOTP MODEL – BASED ON CLOSING PRICES OF 4 JULY 2012<br />
Description Sector/market BB Shares held Recent Last price Crncy % of NAV Valuation<br />
change<br />
(€m)<br />
Quoted companies Software & Services 14.16% 13.71<br />
ECONOCOM Euronext Brussels ECONB BB 196,763 21,500 17.2 € 3.49% 3.37<br />
INIT Deutsche Börse IXX GY 105,200 5,200 18.2 € 1.97% 1.91<br />
NEMETSCHEK Deutsche Börse NEM GR 125,000 -5,000 29.4 € 3.79% 3.67<br />
SAP Deutsche Börse SAP GR 42,500 2,500 47.6 € 2.09% 2.02<br />
TRANSICS Euronext Brussels TRAN BB 250,000 0 7.3 € 1.87% 1.81<br />
UNIT4 Euronext Amsterdam UNIT4 NA 45,330 0 20.3 € 0.95% 0.92<br />
Technology Hardware 6.05% 5.85<br />
EVS BROADCAST Euronext Brussels EVS BB 100,000 8,000 38.6 € 3.98% 3.86<br />
LEM HOLDING Zwitserland LEHN SW 4,869 0 493.0 CHF 2.06% 2.00<br />
Pharma & Biotech 1.98% 1.92<br />
TEVA PHARMACEUTICAL Nasdaq TEVA US 60,000 0 40.1 USD 1.98% 1.92<br />
Health Care Equipment 9.39% 9.09<br />
GERRESHEIMER Deutsche Börse GXI GR 53,500 3,500 38.1 € 2.11% 2.04<br />
NEXUS Deutsche Börse 195,000 7,500 7.8 € 1.56% 1.51<br />
PHARMAGEST INTERACTIVE Euronext Paris 40,000 0 45.5 € 1.88% 1.82<br />
SPHERE MEDICAL HOLDING AIM 930,031 0 0.7 £ 0.88% 0.85<br />
UNITED DRUG Dublin 1,391,786 0 2.1 € 2.96% 2.87<br />
Electrical & Engineering 17.61% 17.05<br />
ANDRITZ Vienna 100,000 -7,500 41.7 € 4.31% 4.17<br />
ARCADIS Euronext Amsterdam 210,000 -15,000 17.6 € 3.81% 3.69<br />
FAIVELEY Euronext Paris 27,500 0 43.1 € 1.22% 1.19<br />
IMTECH Euronext Amsterdam IM NA 194,666 7,500 19.4 € 3.89% 3.77<br />
KENDRION Euronext Amsterdam KENDR NA 112,128 0 17.5 € 2.02% 1.96<br />
SAFT GROUPE Euronext Paris SAFT FP 50,000 0 18.7 € 0.96% 0.93<br />
SCHALTBAU HOLDING Deutsche Börse 16,600 81.2 € 1.39% 1.35<br />
Semiconductors 1.80% 1.74<br />
MELEXIS Euronext Brussels MELE BB 145,133 7,500 12.0 € 1.80% 1.74<br />
Materials 3.13% 3.03<br />
UMICORE Euronext Brussels 82,500 2,500 36.7 € 3.13% 3.03<br />
Other sectors 0.00% 0.00<br />
-<br />
Direct Private Equity Investments Asset type Invested Committed 19.23% 18.62<br />
ANTERYON Semiconductors equity 1.50 € 1.55% 1.50<br />
Software & Services equity 0.63 € 0.65% 0.63<br />
CLEAR2PAY Software & Services equity 5.57 € 5.75% 5.57<br />
IDEA Pharma & Biotech equity 0.16 € 0.17% 0.16<br />
KIADIS Pharma & Biotech equity 2.37 € 2.45% 2.37<br />
MAGWELL Software & Services equity 0.43 € 0.44% 0.43<br />
PROSONIX Pharma & Biotech equity 2.70 £ 2.79% 2.70<br />
SYNTAXIN Pharma & Biotech equity 2.49 £ 2.57% 2.49<br />
TCLAND Pharma & Biotech equity 2.76 € 2.86% 2.76<br />
Capricorn Private Equity Funds & I 5.55 13.30 5.78% 5.55<br />
CAPRICORN CLEANTECH FUND Funds & Div. Cpies equity 1.16 0.55 € 1.21% 1.16<br />
CAPRICORN HEALTH-TECH FUNDFunds & Div. Cpies equity 3.32 11.25 € 3.46% 3.32<br />
CAPRICORN CLEANTECH CO-INVTechnology hardware equity 1.07 1.50 € 1.12% 1.07<br />
3rd Party Private Equity Funds 11.20 4.31 € 11.57% 11.20<br />
Portfolio 90.65% 87.76<br />
Net cash (incl. others & options) 9.35% 9.05<br />
Adjusted equity value 100.00% 96.81<br />
Number of shares (outstanding) 11,529,950<br />
Treasury shares (<strong>for</strong> remuneration purposes, resale, collateral,...) 0.00% 0<br />
Treasury shares (available <strong>for</strong> cancellation) 0.00% 0<br />
Number of shares (<strong>for</strong> per share calculation) 11,529,950<br />
<strong>Quest</strong> <strong>for</strong> <strong>Growth</strong> last price 4.80<br />
Adjusted equity value p.s. 8.40<br />
Current discount 42.83%<br />
Target prices -<br />
Target equity value 96.81<br />
Target equity value p.s. 8.40<br />
Discount to target equity value 42.83%<br />
<strong>KBC</strong>S has a BUY recommendation and a € 6 target price.<br />
The upside potential versus a stock price of € 4.8 equals 25%.<br />
The implied discount of our € 6 target price vs. the target equity value is 28.54%.<br />
Source: <strong>KBC</strong> <strong>Securities</strong><br />
2
MORNING NOTE<br />
5 July 2012<br />
FINANCIAL DATA<br />
Income statement (€ m) 2008 2009 2010 2011<br />
Sales & operating income 0.0 0.0 0.0 0.0<br />
Result from operating activities 0.0 0.0 0.0 0.0<br />
Result from financing activities 0.0 0.0 0.0 0.0<br />
Result from extraordinary activities 0.0 0.0 0.0 0.0<br />
Share of result from associates 0.0 0.0 0.0 0.0<br />
Income taxes 0.0 0.0 0.0 0.0<br />
Discontinued activities 0.0 0.0 1.0 2.0<br />
Minorities 0.0 0.0 1.0 2.0<br />
Net result -48.4 18.1 20.6 -13.3<br />
Adj. net result -48.4 18.1 20.6 -13.3<br />
Balance sheet (€ m) 2008 2009 2010 2011<br />
Intangible assets & goodwill 0.0 0.0 0.0 0.0<br />
Tangible assets 0.0 0.0 0.0 0.0<br />
Participations acc. <strong>for</strong> under equity method 0.0 0.0 0.0 0.0<br />
Other financial assets 0.0 0.0 0.0 0.0<br />
Cash & cash equivalents 0.0 0.0 0.0 0.0<br />
Other assets 0.0 0.0 0.0 0.0<br />
Total assets 67.7 85.6 106.1 91.2<br />
Equity attributable to holders of the parent 67.4 85.4 106.0 91.1<br />
Minorities 0.0 0.0 0.0 0.0<br />
Financial debt 0.0 0.0 0.0 0.0<br />
Other liabilities 0.0 0.0 0.0 0.0<br />
Total liabilities 67.7 85.6 106.1 91.2<br />
Net debt 0.0 0.0 0.0 0.0<br />
Cash flow statement (€ m) 2008 2009 2010 2011<br />
Cash flow from operating activities 0.0 0.0 0.0 0.0<br />
Cash flow from investing activities 0.0 0.0 0.0 0.0<br />
Dividends paid (consolidated) 0.0 0.0 0.0 0.0<br />
Other cash flow from financing 0.0 0.0 0.0 0.0<br />
Fx and changes to the consolidation scope 0.0 0.0 0.0 0.0<br />
Change in cash & cash equivalents 0.0 0.0 0.0 0.0<br />
Per share data (€) 2008 2009 2010 2011<br />
Year-end share price (€) 3.15 4.65 5.31 4.75<br />
Year-end market cap (€ m) 37.1 54.8 62.6 56.0<br />
weighted average # shares 11,789,255 11,789,255 11,789,255 11,529,950<br />
weighted average # shares, diluted 11,789,255 11,789,255 11,789,255 11,529,950<br />
Basic EPS (€) -4.11 1.53 1.74 -1.15<br />
Diluted EPS (€) -4.11 1.53 1.74 -1.15<br />
NBV (€) 5.7 7.2 9.0 7.7<br />
Adj. eq. value 9.9 7.3 9.0 7.9<br />
Premium/disc. 14.89% 35.86% 42.94% 39.72%<br />
DPS (€) 0.00 0.00 0.00 0.00<br />
Dividend yield 0.00% 0.00% 0.00% 0.00%<br />
Ratios 2008 2009 2010 2011<br />
ROE -41.81% 26.83% 24.07% -12.56%<br />
Total return -61.9% 47.6% 14.2% -10.5%<br />
Pay-out ratio (adjusted net result) 0.0% 0.0% 0.0% 0.0%<br />
P/E - 3.03 3.04 -<br />
P/NBV 0.55 0.64 0.59 0.61<br />
Statutory data 2008 2009 2010 2011<br />
Result from operating activities -48.6 16.9 19.4 -15.2<br />
Result from financing activities 0.2 1.2 1.2 1.9<br />
Result from extraordinary activities 0.0 0.0 0.0 0.0<br />
Income taxes 0.0 0.0 0.0 0.0<br />
Profit/loss be<strong>for</strong>e tax -48.4 18.1 20.6 -13.3<br />
Dividend paid (statutory) 0.0 0.0 0.0 0.0<br />
Financial assets 67.1 85.1 104.9 90.0<br />
Other assets 0.6 0.5 0.3 1.2<br />
Total assets 67.7 85.6 107.1 93.2<br />
Capital and reserves 67.4 85.4 106.0 91.1<br />
Provisions and deferred taxation 0.0 0.0 1.0 2.0<br />
Liabilities 0.3 0.1 0.1 0.1<br />
Total assets 67.7 85.6 107.1 93.2<br />
Source: <strong>KBC</strong> <strong>Securities</strong><br />
*Historic valuation data are based on historic prices<br />
3
MORNING NOTE<br />
5 July 2012<br />
DISCLOSURE & DISCLAIMER SECTION<br />
The company disclosures can also be consulted on our website http://www.kbcsecurities.com/disclosures.<br />
<strong>KBC</strong> <strong>Securities</strong> uses an absolute rating system including terms such as Buy, Accumulate, Hold, Reduce and Sell (see definitions below).<br />
BUY<br />
ACCUMULATE<br />
HOLD<br />
REDUCE<br />
SELL<br />
Definition<br />
Expected total return (including dividends) of 10% or more over a 6-month period<br />
Expected total return (including dividends) between 0% and 15% over a 6-month period<br />
Expected total return (including dividends) between -5% and 5% over a 6-month period<br />
Expected total return (including dividends) between –15% and 0% over a 6-month period<br />
Expected total return (including dividends) of -10% or worse over a 6-month period<br />
Due to external factors and in exceptional cases, <strong>KBC</strong> <strong>Securities</strong> allows the use of ratings such as Accept the Offer, Black Out, No Recommendation or<br />
Suspended.<br />
Our analysts assign one of those ratings based on their investment outlook and valuation <strong>for</strong> the concerned stock. The valuation can be based on different<br />
methodologies such as DCF (discounted cash flow), absolute multiples, peer group multiples, sum-of-parts or NAV (Net Asset Value). The valuation is<br />
reflected in a 6-month target price. Occasionally, the expected total return may fall outside of these ranges because of price movement and/or volatility.<br />
Such deviations will be permitted but will be closely monitored. Investors should carefully read the definitions of all ratings used in each research report. In<br />
addition, since the report contains more complete in<strong>for</strong>mation concerning the analyst’s view, investors should carefully read the entire report and not infer<br />
its contents from the rating alone. <strong>KBC</strong> <strong>Securities</strong> discloses the recommendations of its reports to the issuers be<strong>for</strong>e their dissemination. In case the<br />
recommendation has been amended following this disclosure, such amendments will be indicated in the concerned report.<br />
Stock rating % of covered universe % of covered universe with investment banking relationship during last year<br />
BUY 24.80% 33.33%<br />
ACCUMULATE 43.20% 66.67%<br />
HOLD 28.80% 0.00%<br />
REDUCE 1.60% 0.00%<br />
SELL 1.60% 0.00%<br />
<strong>Quest</strong> <strong>for</strong> <strong>Growth</strong> is a Belgian investment company focused on listed and unlisted growth companies with the objective of converting capital gains into taxfree<br />
income through the Privak-structure.<br />
The price target <strong>for</strong> <strong>Quest</strong> <strong>for</strong> <strong>Growth</strong> is based on following parameters: Estimated Equity Value (NAV)<br />
The risks which may impede the achievement of our price target are: high correlation with technology markets and senstive to stock market fluctuations, no<br />
recurring profit, need to succesfully exit unlisted investments, growth is hampered by regularoty payout of realised capital gains<br />
Below is an overview of the stock ratings and target price history in the last 12 months <strong>for</strong> the stock described in this report.<br />
Date Rating Target price<br />
27-JAN-12<br />
Buy<br />
€ 6.00<br />
06-OCT-11<br />
Accumulate<br />
€ 6.00<br />
<strong>KBC</strong> <strong>Securities</strong> will provide periodic updates on companies/industries based on company-specific developments or announcements, market conditions or<br />
any other publicly available in<strong>for</strong>mation.<br />
4
MORNING NOTE<br />
5 July 2012<br />
<strong>KBC</strong> <strong>Securities</strong> NV<br />
Havenlaan 12<br />
Avenue du Port<br />
1080 Brussels<br />
Belgium<br />
+32 2 417 44 04<br />
Regulated by CBFA<br />
<strong>KBC</strong> <strong>Securities</strong> UK<br />
111 Old Broad Street<br />
London EC2N 1PH<br />
UK<br />
+44 20 7418 8900<br />
Regulated by FSA<br />
<strong>KBC</strong> <strong>Securities</strong> US<br />
140 East 45th Street<br />
2 Grand Central Tower - 42nd Floor<br />
NY 10017-3144 New York<br />
US<br />
+1 212 845 2200<br />
Regulated by NASD<br />
<strong>KBC</strong> <strong>Securities</strong> NV Polish Branch<br />
ul. Chmielna 85/87<br />
00-805 Warsaw<br />
Poland<br />
+48 22 581 08 00<br />
Regulated by PFSA<br />
<strong>KBC</strong> <strong>Securities</strong> Patria<br />
Jungmannova 745/24<br />
110 00 Prague 1<br />
Czech Republic<br />
+420 221 424 111<br />
Regulated by CNB<br />
<strong>KBC</strong> <strong>Securities</strong> NV Hungarian Branch<br />
7/8 Roosevelt square<br />
1051 Budapest<br />
Hungary<br />
+361 483 4005<br />
Regulated by PSZAF<br />
<strong>KBC</strong> <strong>Securities</strong> NV Bulgarian Branch<br />
22 Gotze Delchev Blvd, Entr. 2<br />
1404 Sofia<br />
Bulgaria<br />
Tel: +359 2 858 33 11<br />
Regulated by FSC<br />
<strong>KBC</strong> <strong>Securities</strong> Romania<br />
11-15 Tipografilor Street<br />
S-Park A2 Building<br />
Bucharest-1<br />
Romania<br />
+40 21 40 84 200<br />
Regulated by CNVM<br />
BDD <strong>KBC</strong> <strong>Securities</strong> a.d.<br />
Cincar Jankova 3<br />
11000 Belgrade<br />
Serbia<br />
+381 11 21 80 856<br />
Regulated by SSEC<br />
<strong>Analyst</strong> certification: The analysts identified in this report each certify, with respect to the companies or securities that the individual analyses that (i) the views<br />
expressed in this publication reflect his or her personal views about the subject companies and securities, and (ii) he or she receives compensation that is based upon<br />
various factors, including his or her employer’s total revenues, a portion of which are generated by his or her employer’s investment banking activities, but not in<br />
exchange <strong>for</strong> expressing the specific recommendation(s) in this report.<br />
This publication has been prepared by <strong>KBC</strong> <strong>Securities</strong> NV which is regulated by CBFA (Banking, Finance and Insurance Commission) or one of its European<br />
subsidiaries (together "<strong>KBC</strong> <strong>Securities</strong>"). This publication is provided <strong>for</strong> in<strong>for</strong>mational purposes only and is not intended to be an offer, or the solicitation of any offer, to<br />
buy or sell the securities referred to herein. No part of this publication may be reproduced in any manner without the prior written consent of <strong>KBC</strong> <strong>Securities</strong>.<br />
The in<strong>for</strong>mation herein has been obtained from, and any opinions herein are based upon, sources believed reliable, but neither <strong>KBC</strong> <strong>Securities</strong> nor its affiliates<br />
represent that it is accurate or complete, and it should not be relied upon as such. All opinions, <strong>for</strong>ecasts, and estimates herein reflect our judgement on the date of this<br />
publication and are subject to change without notice.<br />
From time to time, <strong>KBC</strong> <strong>Securities</strong>, its principals or employees may have a position in the securities referred to herein or hold options, warrants or rights with respect<br />
thereto or other securities of such issuers and may make a market or otherwise act as principal in transactions in any of these securities. Any such persons may have<br />
purchased securities referred to herein <strong>for</strong> their own account in advance of the release of this publication. <strong>KBC</strong> <strong>Securities</strong> and principals or employees of <strong>KBC</strong><br />
<strong>Securities</strong> may from time to time provide investment banking or consulting services to, or serve as a director of a company being reported on herein.<br />
This publication is provided solely <strong>for</strong> the in<strong>for</strong>mation and use of professional investors who are expected to make their own investment decisions without undue<br />
reliance on this publication. Investors must make their own determination of the appropriateness of an investment in any securities referred to herein based on the<br />
merits and risks involved, their own investment strategy and their legal, fiscal and financial position. Past per<strong>for</strong>mance is no guarantee <strong>for</strong> future results. By virtue of this<br />
publication, none of <strong>KBC</strong> <strong>Securities</strong> or any of its employees shall be responsible <strong>for</strong> any investment decision.<br />
<strong>KBC</strong> <strong>Securities</strong> has implemented certain in-house procedures known as Chinese walls that aim to prevent the inappropriate dissemination of inside in<strong>for</strong>mation. E.g. a<br />
Chinese wall surrounds the corporate finance department within <strong>KBC</strong> <strong>Securities</strong>. Further measures have been taken with regard to the separation of certain activities<br />
that could lead to conflicts of interest with other activities within <strong>KBC</strong> <strong>Securities</strong>.<br />
In the United States this publication is being distributed to U.S. Persons by <strong>KBC</strong> Financial Products USA, Inc., which accepts responsibility <strong>for</strong> its contents. Orders in<br />
any securities referred to herein by any U.S. investor should be placed with <strong>KBC</strong> Financial Products USA, Inc. and not with any of its <strong>for</strong>eign affiliates. <strong>KBC</strong> FP USA<br />
Inc. and/or its affiliates may own 1% or more of the subject company's common equity securities. <strong>KBC</strong>FP USA Inc. or its affiliates may have managed or co-managed a<br />
public offering of the subject company's securities in the past 12 months, or received compensation <strong>for</strong> investment banking services from the subject company in the<br />
past 12 months, or expect to receive or intend to seek compensation <strong>for</strong> investment banking services from the subject company in the next three months. Any U.S.<br />
recipient of this report that is not a bank or broker-dealer and that wishes to receive further in<strong>for</strong>mation regarding, or to effect any transaction in, any security discussed<br />
in this report, should contact and place orders with <strong>KBC</strong> Financial Products USA Inc. This report is being distributed in the United States solely to investors that are (i)<br />
"major U.S. institutional investors" (within the meaning of SEC Rule 15a-6 and applicable interpretations relating thereto) that are also "qualified institutional buyers"<br />
(QIBs) within the meaning of SEC Rule 144A promulgated by the United States <strong>Securities</strong> and Exchange Commission pursuant to the <strong>Securities</strong> Act of 1933, as<br />
amended (the "<strong>Securities</strong> Act") or (ii) investors that are not "U.S. Persons" within the meaning of Regulation S under the <strong>Securities</strong> Act and applicable interpretations<br />
relating thereto. The offer or sale of certain securities in the United States may be made to QIBs in reliance on Rule 144A. Such securities may include those offered<br />
and sold outside the United States in transactions intended to be exempt from registration pursuant to Regulation S. This report does not constitute in any way an offer<br />
or a solicitation of interest in any securities to be offered or sold pursuant to Regulation S. Any such securities may not be offered or sold to U.S. Persons at this time<br />
and may be resold to U.S. Persons only if such securities are registered under the <strong>Securities</strong> Act of 1933, as amended, and applicable state securities laws, or<br />
pursuant to an exemption from registration. The products sold by <strong>KBC</strong> Financial Products USA, Inc or any affiliate thereof, including <strong>KBC</strong> <strong>Securities</strong> or <strong>KBC</strong> Financial<br />
Products UK Limited, are not insured by the FDIC, are not obligations of or guaranteed by <strong>KBC</strong> Bank NV or its affiliates, and are subject to investment risks, including<br />
possible loss of the entire amount invested.<br />
This publication is <strong>for</strong> distribution in or from the United Kingdom only to persons who are authorised persons or exempted persons within the meaning of the Financial<br />
Services and Markets Act 2000 of the United Kingdom or any order made thereunder or to investment professionals as defined in Section 19 of the Financial Services<br />
and Markets Act 2000 (Financial Promotion) Order 2005 and is not intended to be distributed or passed on, directly or indirectly, to any other class of persons.<br />
This publication is <strong>for</strong> distribution in Canada only to pension funds, mutual funds, banks, asset managers and insurance companies.<br />
The distribution of this publication in other jurisdictions may be restricted by law, and persons into whose possession this publication comes should in<strong>for</strong>m themselves<br />
about, and observe, any such restrictions. In particular this publication may not be sent into or distributed, directly or indirectly, in Japan or to any resident thereof.<br />
Copyright © 2010 <strong>KBC</strong> <strong>Securities</strong>