Analyst Report ING - Quest for Growth
Analyst Report ING - Quest for Growth
Analyst Report ING - Quest for Growth

Create successful ePaper yourself
Turn your PDF publications into a flip-book with our unique Google optimized e-Paper software.
EQUITY RESEARCH<br />
Benelux Morning Notes 26 April 2013<br />
Extel Europe Survey 2013<br />
click to vote:<br />
http://www.extelsurveys.com/<br />
Sales desks<br />
Amsterdam +31 20 563 2121<br />
Brussels +32 2 547 1377<br />
New York +1 646 424 6033<br />
Research contacts (click here)<br />
Benelux Morning Notes<br />
26 April 2013<br />
COMPANY COMMENTS<br />
AMG: 1Q13 preview, further focus on cash-flow<br />
Arseus: CMD shows still a lot of potential<br />
Ballast Nedam: toughen it out, Part II<br />
Exmar: 1Q13 in line with expectations, no guidance<br />
Galapagos, UCB: Pfizer’s Xeljanz does not receive European approval<br />
Nutreco: Increases stake in Eqyptian tilapia feed producer<br />
<strong>Quest</strong> <strong>for</strong> <strong>Growth</strong>: strong 1Q13 wipes out carried <strong>for</strong>ward losses<br />
Royal Ten Cate: 1Q13 beats consensus <strong>for</strong>ecasts<br />
Telenet: FCF disappoints, time to lock in some profit<br />
Umicore: 1Q13 preview, TP lowered to €35 on lack of visibility on 2014F recycling profit<br />
USG People: 1Q13 results a touch above, significant additional cost savings announced<br />
Van Lanschot: 1Q13 trading update - CT1 ratio ahead, funding ratio slipped<br />
Wessanen: reasonable 1Q13 - margins improving, net debt higher<br />
MACRO NEWS<br />
US: 1Q13 GDP preview…<br />
UK: 1Q13 GDP rises 0.3% QoQ…<br />
France: French unemployment hits record high<br />
THIS MORN<strong>ING</strong>’S RESEARCH (CLICK ON LINK FOR FULL REPORT)<br />
BAM/Yes, the storm is still raging/BUY<br />
BAM appears to be managing fine in an ever worsening home market. Reviewing the FY12 results,<br />
and taking into account BAM’s FY13F outlook, the risk-reward balance remains clearly in favour of<br />
reward. While we appreciate management’s realistic view on the current very poor market conditions<br />
in the Netherlands, we also see increasingly more upside potential emerging within the activity<br />
clusters <strong>for</strong> when the market finally settles or even starts to recover. We keep our BUY and €5.0 TP.<br />
Fugro/Back to the drawing table/HOLD (previously Buy)<br />
In spite of the turmoil over the last six months, we believe risks remain, with underper<strong>for</strong>ming assets<br />
and a strategic review demanding much from the new management team. With Fugro’s FY13 looking<br />
unexciting – especially 1H13, which could be lower than what markets expect – we downgrade to<br />
HOLD. Based on a DCF valuation and a peer group valuation, we arrive at a target price of €47.<br />
Macintosh/Weather gods were not well-inclined in 1Q13/HOLD<br />
Macintosh experienced a weak first quarter as sales dropped by 14% YoY, clearly impacted by weak<br />
Dutch consumer confidence, but also due to continuous extreme weather conditions. Demand picked<br />
up with the arrival of the sun in mid-April. On the bright side, the organisation maintained a stable<br />
gross margin and operating margins, pointing to benefits from cost containment initiatives. We lower<br />
our FY13F EPS by 16% to €0.45 and maintain our HOLD rating and €9.0 target price on the stock.<br />
Unilever NV/Not a shiny quarter, but yield provides com<strong>for</strong>t/HOLD<br />
Unilever reported a slower-than-expected start to the year, but this was mostly explained by one-off<br />
factors such as weather or price reversals in the spreads business. The continued roll-out in<br />
Personal Care (of TRESemme) means continued strong growth in this important division.<br />
Furthermore, emerging market growth continues to be solid at 10.4% in the quarter (no signs of<br />
slowdown compared with peers). We believe that EPS <strong>for</strong> 2013 is still too high and expect some<br />
trimming of estimates, but we see limited downside risk (<strong>for</strong> now) <strong>for</strong> the shares in the current<br />
environment. HOLD maintained.<br />
<strong>ING</strong> Week Ahead/Week 18: 29 April-3 May 2013<br />
The <strong>ING</strong> Week Ahead contains: Results due out next week<br />
research.ing.com<br />
SEE THE DISCLOSURES APPENDIX FOR IMPORTANT DISCLOSURES & ANALYST CERTIFICATION1
Benelux Morning Notes 26 April 2013<br />
Company comments<br />
Maintained<br />
Buy<br />
Price (25/04/13) €7.00<br />
Maintained<br />
Target price (12m) €9.00<br />
Forecast total return 28.6%<br />
Market cap<br />
Bloomberg<br />
€192.9m<br />
AMG NA<br />
AMG: 1Q13 preview, further focus on cash-flow<br />
AMG reports 1Q13 earnings on 03 May 2013 at 7.00 CET and hosts a conference call at<br />
8.30 CET on the same day (call-in on +44 207 153 2027).<br />
AMG 1Q13 key estimates (US$m)<br />
1Q12 4Q12 1Q13F % YoY<br />
Sales 324.0 275.2 307.7 -5.0%<br />
Processing REBITDA 12.6 10.9 -13.2%<br />
Engineering REBITDA 3.5 5.1 44.7%<br />
Mining REBITDA 5.9 4.0 -32.4%<br />
REBITDA 22.0 17.7 20.0 -9.1%<br />
REBIT 14.8 7.4 12.0 -18.7%<br />
EBIT 11.4 4.1 9.5 -16.7%<br />
Net profit 3.5 -3.5 1.4 -60.0%<br />
<strong>Report</strong>ed EPS (US$) 0.13 -0.13 0.05 -60.0%<br />
Net debt 206.4 194.2 190.8 -7.6%<br />
Order backlog ES 176.2 165.3 165.0 -6.4%<br />
Source: Company data, <strong>ING</strong> estimates<br />
We expect group REBITDA to be down 5% YoY but up 12% QoQ to US$20m. YoY, the<br />
weaker economic trading conditions, mainly in Europe, should have impacted prices and<br />
volumes in certain materials, but we expect a sequential improvement due to cost<br />
savings and some seasonality. Recall that AMG guided <strong>for</strong> a 2.5% improvement in gross<br />
margin and 5% reduction in SG&A in FY13.<br />
In Processing, we expect 1Q13F REBITDA down 13% YoY to US$10.9m on weaker<br />
chrome metal prices. Still, we expect a sequential improvement via higher ferrovanadium<br />
prices and volumes post the completed expansion of the spent catalyst processing<br />
facility. Demand from the aerospace alloys should continue to be stable, with long-term<br />
growth tied to robust demand from more fuel-efficient commercials aircrafts.<br />
In Engineering, we expect 1Q13F REBITDA up 45% YoY to US5.1m. The backlog should<br />
remain stable at low levels (US$165m). Demand from alternative energy (solar and<br />
nuclear) should not rebound in the near term. Demand from the aerospace market should<br />
remain stable QoQ, with perhaps some upside from new niche vacuum technology<br />
applications <strong>for</strong> the growing electronics industry and energy industry. Finally, AMG’s Heat<br />
Treatment Service facilities in Europe and North America are operating near or at<br />
capacity and demand is <strong>for</strong>ecast to remain strong. The latter could lead to capacity<br />
expansion in 2013.<br />
In Mining, we anticipate 1Q13F REBITDA down 32% YoY to US$4.0m. Demand and<br />
pricing <strong>for</strong> silicon metal and natural graphite were very challenging in 4Q12. However,<br />
both should have rebounded slightly in terms of volume in early 2013. Further, antimony<br />
prices have been continuously declining. The market outlook <strong>for</strong> tantalum is strong with<br />
supply shortages and industry consolidation leading to higher prices. AMG’s new longterm<br />
tantalum supply contract should start to boost REBITDA as of mid 2013F.<br />
We expect the US$20m REBITDA to translate into a US$11.9m cash from operating<br />
activities (impact from working capital assumed at US$0.0m) and US$3.4m free cash flow<br />
(capex estimated at US$8.5m). Hence, net debt should decline further to US$190.8m<br />
(2.3x 12mth trailing net debt/REBITDA, vs. 3.0x covenant).<br />
Investment case: AMG is an <strong>ING</strong> Benelux top pick on (1) its outlook <strong>for</strong> cash flow growth<br />
in 2013F in spite of macroeconomic and top line headwinds, (2) attractive 10% equity<br />
FCF yield including expansion capex on 2013F, (3) attractive assets in critical materials<br />
2
Benelux Morning Notes 26 April 2013<br />
(we believe the NPV of AMG’s tantalum mine alone accounts <strong>for</strong> c.23% of the company<br />
EV and (4) potential divestments to unlock value.<br />
Filip De Pauw, Brussels +32 2 547 60 97<br />
3
Benelux Morning Notes 26 April 2013<br />
Maintained<br />
Buy<br />
Price (25/04/13) €19.40<br />
Maintained<br />
Target price (12m) €23.00<br />
Forecast total return 22.1%<br />
Market cap<br />
Bloomberg<br />
€592.1m<br />
RCUS BB<br />
Arseus: CMD shows still a lot of potential<br />
Arseus hosted a CMD in the Fagron headquarters in Capelle aan den Ijssel on the 25 th of<br />
April. There were presentations from Ger van Jeveren (CEO of Arseus and CEO of<br />
Fagron), Jan Peeters (CFO of Arseus and CFO of Fagron), Jacob Jackson (current CEO<br />
of Freedom Pharmaceuticals and the upcoming CEO of Fagron North-America) and Dirk<br />
van Lerberghe CEO of Corilus<br />
We believe the most interesting highlights of the day were;<br />
1) The CEO’s personal ambition to reach €100m in EBITDA in 2014, driven by<br />
continuing organic sales growth of 8-10%, continuous margin improvements and<br />
acquisitions. The company sees a lot of growth potential in the US and Canada,<br />
which are still relatively large profit pools and in pharmaceutical compounding<br />
<strong>for</strong> hospitals in Europe.<br />
2) Arseus’ management is targeting double digit margins <strong>for</strong> all divisions; if<br />
achieved there is still significant upside <strong>for</strong> the Healthcare Solutions division<br />
which reported EBITDA margins of 1.8% in 2012. This would imply €10m upside<br />
in our current EBITDA <strong>for</strong>ecast <strong>for</strong> the division as we do not <strong>for</strong>ecast a margin<br />
recovery.<br />
3) According to the CFO, there is a high likelihood that one or more divisions will<br />
be sold in the next 3-4 years. We believe the Healthcare Solutions and<br />
Healthcare Specialties are most likely to be put on the block. Still management<br />
would first like to see sales and margins recovering be<strong>for</strong>e a sale of these<br />
divisions can be concluded.<br />
4) Management has plans to make at least 5 acquisitions in 2013 of which<br />
Freedom Pharmaceuticals was the latest example. For 2013 the company is<br />
looking <strong>for</strong> acquisitions in Corilus and Fagron.<br />
5) Healthconnect is a software application which enables communication between<br />
different software packages from different producers. Healthconnect gives<br />
Corilus an opportunity to visit clients and cross sell Corilus software to clients<br />
who are currently not using Corilus software.<br />
6) Management sees working capital as at the correct % of sales and does not see<br />
a lot of room to reduce working capital further.<br />
7) The company is aiming <strong>for</strong> a net debt/EBITDA ratio of c.2.5x with covenants<br />
being at 3.25x net debt/EBITDA.<br />
8) After the acquisition of Freedom Pharmaceuticals Fagron has moved to a<br />
number 2 position in the USA behind PCCA, with Medisca being a number 3<br />
and Letco medical being number 4. The total size of the US market is c.US$<br />
600m and growing by 5% pa. Arseus sees US$1m in cost savings potential from<br />
the Freedom Pharmaceuticals acquisition.<br />
We do not change our estimates or rating on Arseus, but continue to see significant<br />
upside in the shares as our TP of €23 is still 18% above the current share price.<br />
Valuation remains attractive at 11x PER 2014F and 9x EV/EBITDA14F, and given<br />
that there are still more potential acquisitions and divestments coming we believe<br />
enough triggers remain.<br />
Fabian Smeets, Amsterdam +31 20 501 3478<br />
4
Benelux Morning Notes 26 April 2013<br />
Maintained<br />
Hold<br />
Price (25/04/13) €10.62<br />
Maintained<br />
Target price (12m) €11.50<br />
Forecast total return 8.3%<br />
Market cap<br />
Bloomberg<br />
€102.7m<br />
BALNE NA<br />
Ballast Nedam: toughen it out, Part II<br />
Ballast Nedam released a trading update this morning, the release starts with the remark<br />
that pressure on markets was undiminished in 1Q13, leading to fierce competition, price<br />
pressure and bankruptcies. The competition faced by capacity-driven markets in<br />
particular has been cut-throat.<br />
Ballast’s material restructuring programme announced at the end of last year is<br />
proceeding on schedule. The company stated that its revenue and results fell slightly<br />
short versus 1Q12 and the company expects to report a break even operating income in<br />
1H12. Last year in 1H12 Ballast reported €4m of EBIT (generally most of the operating<br />
result is generated in 2H). Management expects a similar effect this year as the FY13F<br />
EBUIT guidance was reiterated, but naturally contains more risk now, hence we expect<br />
this to be taken negatively by the market today. We aim <strong>for</strong> FY13F of €12.4m and<br />
Bloomberg consensus goes <strong>for</strong> FY13F EBIT of €12.5m.<br />
Ballast’s net debt position improved to €127m, from €153m in 1Q12, and the order book<br />
remained stable at €1.73bn, from €1.76bn at the end of 2012.<br />
All in all the poor market conditions are no surprise, the restructuring ef<strong>for</strong>ts are still<br />
progressing and will show benefits later on in the year and next year. EBIT guidance is<br />
maintained but contains more risk as Ballast now expects a break-even result in 1H13F<br />
(from €4m in 1H12). The shares trade at 4.0x EV/EBITDA and PER 2013F of 32.7x on<br />
very depressed earnings <strong>for</strong>ecasts. The biggest deviation from consensus is that we do<br />
not expect a dividend will be paid over 2013F either (as in 2012) as focus on core capital<br />
and net debt prevails, in our view.<br />
Tijs Hollestelle, Amsterdam +31 20 563 8789<br />
Maintained<br />
Hold<br />
Price (25/04/13) €7.01<br />
Maintained<br />
Target price (12m) €8.20<br />
Forecast total return 25.2%<br />
Market cap<br />
Bloomberg<br />
€393.7m<br />
EXM BB<br />
Exmar: 1Q13 in line with expectations, no guidance<br />
Exmar announced its 1Q13 results yesterday after the close. These were in line with <strong>ING</strong><br />
expectations, with EBIT excluding one offs at $10.4m, against expectations of $10m. The<br />
company did not give any outlook on FY13, not even guidance on a divisional level. A<br />
$54m book gain was made on the divestment of 50% of its LPG business and was as<br />
guided.<br />
Exmar 1Q13 results summary<br />
€m 1Q13A 1Q13F 1Q12A YoY growth<br />
Turnover 99.2 83.6 107.2 -7%<br />
EBITDA 79.8 82 52.5 52%<br />
EBIT 64.6 67 33.2 95%<br />
- LNG 8.1 8.0 8.0 1%<br />
- Offshore 0.7 1.0 22.0 -97%<br />
- LPG 56.2 59.0 4.2 1238%<br />
- Services and other -0.4 -1.0 -1.0 -60%<br />
Source: Company data, <strong>ING</strong> estimates<br />
We keep our Hold rating with a TP of €8.20, at a 10-15% discount to its NAV. Overall,<br />
Exmar’s initiatives in LNG should be welcomed as well as other portfolio changes.<br />
Quirijn Mulder, Amsterdam +31 20 563 8757<br />
5
Benelux Morning Notes 26 April 2013<br />
Maintained<br />
Buy<br />
Price (25/04/13)<br />
€46.14<br />
Maintained<br />
Target price (12m)<br />
€55.00<br />
Forecast total return 21.4%<br />
Market cap<br />
Bloomberg<br />
€8,314.4m<br />
UCB BB<br />
Galapagos<br />
Buy (maintained)<br />
Price (25/04/13) €20.30<br />
Maintained<br />
Target price (12m) €22.00<br />
Forecast total return 8.4%<br />
Market cap<br />
Bloomberg<br />
€8,314.4m<br />
GLPG. BB<br />
Galapagos, UCB: Pfizer’s Xeljanz does not receive European<br />
approval<br />
European regulators declined to approve marketing of Pfizer Inc's new rheumatoid<br />
arthritis treatment Xeljanz, citing the risks of the drug compared with its potential benefits.<br />
We believe the news is positive <strong>for</strong> UCB, with Cimzia achieving 1Q13 sales of €122m, of<br />
which €36m in Europe. This blocks one competitor from entering the European space<br />
and we there<strong>for</strong>e believe this removes a potential treat to UCB’s Cimzia at least <strong>for</strong> the<br />
next 12 months. Cimzia achieved €467m in annual sales in 2012 of which €133m was<br />
achieved in Europe.<br />
We believe the news is potentially negative <strong>for</strong> Galapagos which is currently working on a<br />
JAK1 inhibitor (GLPG0634), and although we believe GLPG0634 has a much better<br />
efficacy profile than Xeljanz, the potential longer term side effect profile is less clear. We<br />
will have to wait until Galapagos phase II data is published to get more clarity on medium<br />
term efficacy and side effect profile.<br />
Pfizer said it plans to appeal and "immediately seek a re-examination of the opinion" by<br />
the European Medicines Agency's Committee <strong>for</strong> Medicinal Products <strong>for</strong> Human Use<br />
(CHMP).<br />
Pfizer said in a statement that the committee considered that treatment with Xeljanz<br />
improved the signs and symptoms of rheumatoid arthritis and the physical function of<br />
patients but did not believe that a consistent reduction in disease activity and structural<br />
damage to joints had been sufficiently demonstrated. The CHMP also raised questions<br />
about side effects including serious infections, gastrointestinal per<strong>for</strong>ations and<br />
malignancies observed in trials of the pill.<br />
Xeljanz is approved in the United States, Japan and Russia <strong>for</strong> the treatment of adults<br />
with moderate-to-severe active rheumatoid arthritis.<br />
Fabian Smeets, Amsterdam +31 20 501 3478<br />
6
Benelux Morning Notes 26 April 2013<br />
Maintained<br />
Hold<br />
Price (25/04/13) €70.92<br />
Maintained<br />
Target price (12m) €71.80<br />
Forecast total return 4.5%<br />
Market cap<br />
Bloomberg<br />
€2,516.9m<br />
NUO NA<br />
Nutreco: Increases stake in Eqyptian tilapia feed producer<br />
In our view this transaction is in line with its strategic track of increasing non-salmonid<br />
exposure (Tilapia) and in line with increasing emerging markets exposure (growing in the<br />
Africa/ME region). We believe Nutreco acquired the remaining stake at a level in line with<br />
EV/EBIT multiples we are familiar with (in the range of 7-9x). Based on sales of €25m we<br />
believe EV is in the range of €10-€15m<br />
Nutreco has signed an agreement to acquire the remaining 67% share held by its two<br />
partners in its Egyptian participation Hendrix Misr. Nutreco entered the Egyptian market<br />
in 2001 by acquiring 33% of Hendrix Misr which has developed successfully since then.<br />
Full ownership of Hendrix Misr offers Nutreco a good base to expand its activities in this<br />
attractive growth market. Egypt is the world's second largest tilapia producer after China.<br />
The Egyptian market <strong>for</strong> extruded fish feed is expected to achieve double-digit growth <strong>for</strong><br />
the <strong>for</strong>eseeable future.<br />
Hendrix Misr is Egypt's market leader in extruded fish feed (mainly tilapia) which is sold<br />
under the trade name Skretting, and a leading producer of poultry feed concentrates.<br />
Total revenue in 2012 was approximately EUR 25 million. Nutreco intends to expand the<br />
current fish feed capacity of 25,000 tonnes to 75,000 tonnes by 2015.<br />
Nutreco currently trades at 13x PER <strong>for</strong> FY13F and on 7.3x EV/EBITDA <strong>for</strong> 2013F which<br />
we believe is warranted. However we do not see enough upside to alter our<br />
recommendation.<br />
Marco Gulpers, Amsterdam +31 20 563 8755<br />
Maintained<br />
Hold<br />
Price (25/04/13) €6.60<br />
Previous target price (12m) €6.50<br />
Target price (12m) €6.70<br />
Forecast total return -1.5%<br />
Market cap<br />
Bloomberg<br />
#VALUE!<br />
QFG BB<br />
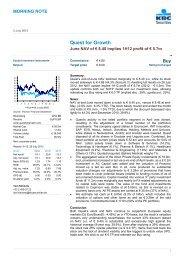
<strong>Quest</strong> <strong>for</strong> <strong>Growth</strong>: strong 1Q13 wipes out carried <strong>for</strong>ward losses<br />
<strong>Quest</strong> reported 1Q13 NAV of €111.7m, or €9.68 per share, up from €106.7m at FY12.<br />
Hence, ROE <strong>for</strong> the period came in at 4.6%, a slight underper<strong>for</strong>mance versus the<br />
STOXX 600 Europe ex-financials (+4.8%) and the STOXX Europe technology index<br />
(+5.3%). The net result <strong>for</strong> the period amounted to €4.9m, or €0.42/ per share (1Q12:<br />
€0.54 per share) wiping out the carried <strong>for</strong>ward losses of €3.6m.<br />
The return of the quoted portfolio came in at 8%. Alpha <strong>for</strong> the quarter was 3.2% (vs<br />
SXXNFP). <strong>Quest</strong> lowered its stakes in Econocom, Arcadis, Nemetscheck, EVS, Init<br />
Innovation, LEM Holding and Parmagest. The SAP, Fresenius, LPKF, Tomra Systems,<br />
Gerresheimer, United Drug, Centrotec, Schaltbau and Umicore stakes were raised. Barco<br />
entered the portfolio while Imtech and Faively exited. Despite clogged up exit markets the<br />
unquoted portfolio’s return was slightly positive on the back of some revaluations and<br />
despite an additional writedown of €316K. <strong>Quest</strong>’s net cash position rose from €1.9m at<br />
FY12 to €4.6m during the quarter. Costs amounted to 1.8% of NAV (annualized).<br />
Commitments to third party funds amounted to €19.9m.<br />
Despite weakening macro readings <strong>Quest</strong> remains confident in the longer term prospects<br />
of equity markets. Yet, noting that markets were up 10 months in a row, <strong>Quest</strong> does not<br />
rule out a short term correction. Consequently, <strong>Quest</strong> opted to hedge part of its market<br />
risk <strong>for</strong> the first time since May ’12.<br />
All-in-all, <strong>Quest</strong> posted a very solid quarter on the back of a strong per<strong>for</strong>mance of the<br />
Quoted portfolio. We keep our cautious stance, despite <strong>Quest</strong> being once again eligible<br />
<strong>for</strong> dividend payments, since we are still early in the FY. Our updated NAV stands at<br />
€9.63 per share, implying a 31% discount <strong>for</strong> the current share price. We lift our Target<br />
Price to €6.7, continuing to value <strong>Quest</strong> at a 30% discount to NAV.<br />
Matthias Maenhaut, Brussels +32 2 547 7523<br />
7
Benelux Morning Notes 26 April 2013<br />
Maintained<br />
Buy<br />
Price (25/04/13) €18.15<br />
Maintained<br />
Target price (12m) €23.00<br />
Forecast total return 29.5%<br />
Market cap<br />
Bloomberg<br />
€472.5m<br />
KTC NA<br />
Royal Ten Cate: 1Q13 beats consensus <strong>for</strong>ecasts<br />
Ten Cate released in-line 1Q13 results this morning. Revenue arrived at €242m, 5%<br />
below our <strong>for</strong>ecast and 2% below the company-collected consensus <strong>for</strong>ecast. EBITA<br />
came in at €12.5m, undershooting our <strong>for</strong>ecast by 14% but com<strong>for</strong>tably beating the<br />
consensus number, by 4%. The consensus FY13F EBITA estimate is 16% above our<br />
<strong>for</strong>ecast, suggesting that EBITA in the remaining three quarters of 2013F has to rise by<br />
55% YoY. <strong>ING</strong> aims <strong>for</strong> a 29% rise in EBITA in the three reaming quarters of 2013F.<br />
Ten Cate 1Q13 results<br />
(€m) 1Q12 1Q13A growth (%) 1Q13 <strong>ING</strong> Diff. (%) Cons. Diff. (%)<br />
Revenue 257.6 241.8 -6.1 254.0 -4.8 247.0 -2.1<br />
EBITA 13.2 12.5 -5.3 14.3 -12.6 12.0 4.2<br />
EBITA margin (%) 5.1 5.2 5.6 4.9<br />
Net profit 5.1 4.6 -9.8 5.2 -11.5 4.3 7.0<br />
Source: Company data, <strong>ING</strong> estimates<br />
Ten Cate stated that its activities recovered in line with expectations. Synthetic turf<br />
per<strong>for</strong>med well and Defender M grew strongly, above management’s expectations, but<br />
lower than the relatively strong 1Q12 (note that in 1Q12 sales of products to the US Army<br />
were below the exceptionally high level of sales in 1Q11). EBITA of the Advanced<br />
Textiles & Composites sector decreased vs. 1Q12. The EBITA of the Geosynthetics &<br />
Grass sector increased substantially. Net debt decreased by €6m from year end,<br />
reflecting NWC improvements and solid cash flow generation.<br />
Tijs Hollestelle, Amsterdam +31 20 563 8789<br />
8
Benelux Morning Notes 26 April 2013<br />
Maintained<br />
Hold<br />
Price (25/04/13) €42.25<br />
Maintained<br />
Target price (12m) €42.00<br />
Forecast total return 18.2%<br />
Market cap<br />
Bloomberg<br />
€4,744.1m<br />
TNET BB<br />
Telenet: FCF disappoints, time to lock in some profit<br />
Telenet’s 1Q13 results were in line on subscriber data and sales but below on REBITDA<br />
(2%) and FCF. The FY13 guidance was reiterated and is achievable in our opinion. All in<br />
all, we see no reason to change our estimates and our €42 DCF-derived TP. We advise<br />
investorss to take any profits as (1) our target price has been reached; (2) we do not<br />
expect Liberty Global to bid on Telenet be<strong>for</strong>e 1Q14; (3) cable regulation and the<br />
introduction of 4G could weaken Telenet’s earnings growth post 2013; (4) Telenet trades<br />
at 16.0x 2013F EV/Oper FCF while Liberty’s bid on Virgin Media implies 14.5x 2013F<br />
EV/Oper FCF (pre synergies).<br />
Despite the competitive environment, Telenet’s subscriber data were robust and in line<br />
with expectations. Mobile net adds amounted to 103K (consensus: 99K; 4Q12: 181K).<br />
The run rate of digital TV net adds slowed to 26K (consensus: 35K; FY12 average: 54K)<br />
but conversion rates remained stable YoY. The churn of basic cable subscribers<br />
amounted to 17K (consensus: 15K; average FY12: 19K), despite increased competition.<br />
Broadband net adds amounted to 22K (consensus: 20K; FY12 average: 21K). Fixed<br />
telephony net adds amounted to 19K (consensus: 18K; FY12 average: 22K). The<br />
sporting Telenet subscriber base grew by 2K QoQ to 197K. Triple play net adds<br />
amounted to 18K (FY12 average: 19K).<br />
Review 1Q13<br />
€m 1Q12 1Q13 % change Consensus<br />
Sales 364.0 405.6 11.4% 404.9<br />
REBITDA 192.6 201.5 4.6% 203.2<br />
REBITDA margin 52.9% 49.7% -6.1% 50.2%<br />
Free cash flow 54.3 (10.0) n/a 55.5<br />
Source: Company data<br />
Sales increased by 11% YoY (consensus: 11%) driven by a growing contribution of the<br />
mobile operations and continued RGU growth in its fixed services. The largest sales<br />
growth came from the mobile business (€35m YoY), driven by RGU growth (367K) and<br />
ARPU growth (23% YoY). The ARPU growth is the result of data-savvy users finding their<br />
way towards Telenet’s mobile services.<br />
Adjusted EBITDA increased by 5% YoY (consensus: 6%). Correcting <strong>for</strong> a €2.5m positive<br />
one off (provision reversal), EBITDA growth amounted to 3% YoY (in line with 4Q12 run<br />
rate). Telenet states that the EBITDA growth is impacted by higher costs associated with<br />
handset sales and subsidies (delta of €10m to €15m YoY). Hence, excluding handset<br />
subsidies, Telenet’s like <strong>for</strong> like EBITDA growth would have amounted to 9.8% YoY.<br />
Given that 2Q & 3Q are typically quarters with low handset subsidies and Telenet will<br />
benefit from its price increases, we expect Telenet’s EBITDA growth to accelerate<br />
substantially in the coming quarters and believe Telenet’s FY13 EBITDA guidance is still<br />
reachable.<br />
FCF disappointed at €-10m (consensus: €56m) due to (1) lower EBITDA generation in<br />
1Q13; (2) €20m higher cash interest expenses reflecting the first semi-annual payment<br />
on the €700m senior secured notes; and (3) a negative trend in working capital (€45m),<br />
driven by the fact that the payment terms of handset suppliers are shorter. Telenet aims<br />
however to improve this by using Liberty Global’s scale.<br />
Telenet reiterated its 2013 outlook. The company guides <strong>for</strong> revenue growth of 10-11%<br />
(consensus: 11%), driven by further growth in the number of multiple-play, digital TV, and<br />
broadband internet subscribers. In addition, the momentum in Telenet's mobile<br />
operations is expected to drive solid incremental growth. Telenet anticipates adjusted<br />
EBITDA growth of 7-8% (consensus: 8%) reflecting a bigger share of mobile revenue<br />
which generates a lower margin compared to its fixed operations. FCF is anticipated to<br />
9
Benelux Morning Notes 26 April 2013<br />
remain stable as compared to 2012 (consensus: +1%), embedding growth in net cash<br />
from operating activities as well as higher interest expenses following the increased debt<br />
level (€700m) as from August 2012.<br />
The shareholders approved the extraordinary dividend of €7.9 per share (19% yield). The<br />
payment is scheduled <strong>for</strong> May 8, 2013 with the stock trading ex-dividend as of May 3,<br />
2013. We believe Liberty Global wants to keep Telenet’s leverage at c.4.5x NFD/EBITDA<br />
and use the excess cash <strong>for</strong> share buy backs.<br />
Emmanuel Carlier, Brussels +32 2 547 7534<br />
10
Benelux Morning Notes 26 April 2013<br />
Maintained<br />
Hold<br />
Price (25/04/13) €34.98<br />
Previous target price (12m) €39.00<br />
Target price (12m) €35.00<br />
Forecast total return 3.0%<br />
Market cap<br />
Bloomberg<br />
€3,913.2m<br />
UMI BB<br />
Umicore: 1Q13 preview, TP lowered to €35 on lack of visibility on<br />
2014F recycling profit<br />
Umicore will publish its 1Q13 trading update (only changing revenues) on 30 April be<strong>for</strong>e<br />
market opening. An analyst call is scheduled <strong>for</strong> 8:30 CET on the same day.<br />
Umicore 1Q13 sales trends (%)<br />
€m 1Q12 1Q13F % change 1H13F<br />
Consensus<br />
Change in group sales (ex metals) 11% -2% n/a 0%<br />
Recycling 8% -4% n/a -1%<br />
Catalysis 18% -2% n/a -1%<br />
Per<strong>for</strong>mance Materials 4% 1% n/a 2%<br />
Energy Materials 12% 3% n/a 4%<br />
Source: Company data, <strong>ING</strong> estimates<br />
Typically, Umicore provides a full-year REBIT guidance range at the 1Q update, and this<br />
should be the main focus in the company’s update. At the FY12 results, Umicore said that<br />
FY13 REBIT was likely to come in below 2012’s €372m in the absence of any<br />
improvement in its end markets and the anticipation of a lower contribution from<br />
Recycling. There were three reasons <strong>for</strong> the latter: (1) the absence of a recovery in<br />
specialty metal prices; (2) higher costs of development/debottlenecking of the Hoboken<br />
smelter; and (3) an additional maintenance shutdown of the Hoboken smelter<br />
(maintenance shutdowns occur every 10 months, and there will be one each in 1Q13 and<br />
4Q13). We currently expect FY13F REBIT to be down 4.7% YoY to €355m, just below<br />
Vara consensus (-4.2% to €356.6m). Given the ongoing macro headwinds in 1Q13, the<br />
lack of visibility on a macro recovery in 2H13F, further declines in specialty metal price<br />
and Umicore’s understandable caution when issuing full-year guidance in April, we would<br />
expect our and consensus full-year estimates to come in at the high end of the guidance<br />
range at best. As such, we do not believe the full-year guidance should be a positive<br />
trigger <strong>for</strong> consensus estimates.<br />
For 1Q13, we anticipate overall group sales (excluding metals) to decline by c.2% YoY<br />
due to the ongoing macro headwinds. Vara consensus expects 1H13 sales to be flat<br />
YoY.<br />
In Recycling (68% of REBIT in 2013F), we expect sales to decline by 4% YoY, which<br />
seems relatively pessimistic, as a 1% 1H13 sales decline is <strong>for</strong>ecast by Vara consensus<br />
(but note the Hoboken maintenance shutdown occurs in 1Q13). With global PMIs just<br />
above 50, we do not think the overall supply environment <strong>for</strong> the different types of<br />
complex residues (non-ferrous residues, electronic scrap and spent catalysts) has<br />
dramatically changed. Prices <strong>for</strong> most metals have declined YoY (and even QoQ), but<br />
precious and base metal price should be broadly hedged <strong>for</strong> the remainder of 2013. As<br />
such, Umicore should ‘only’ feel the impact from weaker specialty metal prices such as<br />
selenium (-35% YoY), tellurium (-40% YoY), ruthenium (-30% YoY) and cobalt (-20%<br />
YoY). Given there is no visibility on which metals Umicore has processed in 1Q13F, a<br />
sales <strong>for</strong>ecast remains challenging, in our view.<br />
In Catalysis (26% of REBIT in 2013F), we expect the company to generate c.2% lower<br />
revenues than the previous year as the European auto industry declines further. 1Q13<br />
vehicle sales in the EU were 9.8% lower than the previous year. However, we expect the<br />
impact on the company to be subdued due to the rebound in the US (+6.3% YoY) and<br />
Asia-Pacific (+2.9% YoY) auto markets. Vara consensus anticipates 1H13 sales down<br />
1% YoY.<br />
We expect 1Q13F sales from Per<strong>for</strong>mance Materials (16% of REBIT in 2013F) to<br />
increase 1%. This seems in line with company guidance of no major improvement in<br />
11
Benelux Morning Notes 26 April 2013<br />
underlying market conditions (the division is mainly geared to European construction).<br />
Vara consensus expects 1H13F sales up 2% YoY.<br />
Finally, we expect sales from Energy Materials (4% of REBIT in 2013F) to increase by<br />
3% YoY mainly driven by growth in the Rechargeable Battery Materials segment (<strong>for</strong><br />
portable electronics and hybrid-electric vehicles), which should continue to offset<br />
weakness in Electro-Optic Materials and Thin Film. Volume growth in Rechargeable<br />
Battery Materials should be driven by unit sales growth of tablets and smartphones<br />
(+70% and +48% respectively in 2013F, according to Gartner) and stronger (hybrid-)<br />
electric car sales in the US (+22% YoY in 1Q13, according to EDTA). Vara consensus<br />
expects 1H13F sales up 4% YoY.<br />
We keep our 2013F REBIT unchanged ahead of the 1Q13 trading update at €355m, but<br />
lower our 2014F REBIT by 6% to €388m. The latter is entirely driven by Recycling. Based<br />
on the double-digit YoY drop in precious and base metal prices, and taking into account<br />
that Umicore seems to be only partially hedged into 2014, we no longer assume REBIT<br />
growth <strong>for</strong> the division, in spite of its planned capacity expansion. We add, however, that<br />
visibility on the division's profitability seems low, as we have little or no disclosure on the<br />
importance of the metal yield (or 'free metal') component to the division's profitability.<br />
Investment case: we maintain our HOLD recommendation, but lower our TP from €39.0<br />
to €35.0: (1) our 2014F estimates seem 5% below consensus, and the risk seems to be<br />
more to the downside amid falling precious metal prices. Yet at the same time, the longterm<br />
growth drivers remain in place: resource scarcity, more stringent emission control<br />
and electrification of the car; (2) we expect post-tax ROACE to fall significantly from<br />
15.6% in 2012 to 13.1% in 2013F, but the number stays materially above WACC in spite<br />
of investing over the cycle; (3) the balance sheet remains strong (0.4x net debt/EBITDA),<br />
which leaves room <strong>for</strong> acquisitions and higher shareholder remuneration; (4) valuation<br />
seems fair on 8.4x 2013F and 7.8x 2014F EV/EBITDA versus a historical average of<br />
8.3x. Our TP reflects the average of 8.3x EV/EBITDA on 2013-14F.<br />
Filip De Pauw, Brussels +32 2 547 60 97<br />
12
Benelux Morning Notes 26 April 2013<br />
Maintained<br />
Buy<br />
Price (25/04/13) €6.22<br />
Maintained<br />
Target price (12m) €7.50<br />
Forecast total return 22.7%<br />
Market cap<br />
Bloomberg<br />
€483.0m<br />
USG NA<br />
USG People: 1Q13 results a touch above, significant additional cost<br />
savings announced<br />
The 1Q13 results are a touch above <strong>ING</strong>F and, in our view, are more or less in line with<br />
Reuters/Bloomberg consensus if adjusted <strong>for</strong> some outliers that can be ignored.<br />
Underlying EBITA came in at €9.4m (<strong>ING</strong>F: €7.9m, consensus: €10.5-11.1m) but<br />
adjusted around the reported number, we estimate. A key point in the results are the<br />
additional significant cost savings announced - €25m pa, representing c.5% of the total<br />
cost base and just over 1% of sales and c.30% of EBITA 2014F. The CEO stated that this<br />
is an “at least” number! We expect a positive share price reaction after the weak trading<br />
over the last weeks. -8% in last three weeks.<br />
Revenues were more or less in line, at -10% organic growth vs <strong>ING</strong>F at -9%. Working day<br />
adjusted this was -6.2%, vs -5.7% estimated, so a minor deviation. The trend was rather<br />
stable through 1Q13 with January at -6.9% and March at -6.2% and we learned from<br />
contact with the company that the trend into 2Q13 (although early) is similar to the<br />
Randstad statement (slight improvement) and the CEO flagged the trend from 4Q12 at -<br />
11% to -6% in 1Q13. NL was stable in Q1 at -5% WDA in the quarter and -5% as well in<br />
March. Note that the new contract wins from 4Q12 will kick in in Q2 as well as <strong>for</strong><br />
Belgium.<br />
Gross margin was a touch higher at 20.4% and was impacted by a negative 20bp from<br />
working days while the CEO also mentioned that the hard winter in NL had a negative<br />
impact on Technicum (engineering and construction). This added to idle time which has<br />
been managed back now and should support the gross margin. We thus see some<br />
upside to our gross margin estimates.<br />
SG&A was stronger than expected and guided. USG had guided <strong>for</strong> a €120m run-rate but<br />
reported €117m. In addition, USG announced an additional €25m cost savings annually -<br />
c.30% of EBITA 2014F and 5% of the current cost base and stated by the CEO as an “at<br />
least” number. This significant cost savings results from further simplification of the<br />
organisation following the divestment of the general staffing outside Benelux/Germany<br />
and involves streamlining of the professionals organisation to include just one brand, less<br />
offices, less management layers.<br />
Net debt came in at €187m, a decline of €54.8m vs 4Q12. This includes proceeds <strong>for</strong><br />
Energy divestment of €69.1m and excludes €20m proceeds from sale of the generalist<br />
business. It seems however that the negative working capital impact from the sale of the<br />
generalist business is already in but not the proceeds - we expect a further reduction of<br />
net debt of c.€15m on top of the proceeds.<br />
Other items: there is a €16.9m book loss from the sale of the generalist staffing excluding<br />
deferred tax assets and proceeds from sale of Energy is €69.1m.<br />
Marc Zwartsenburg, Amsterdam +31 20 563 8721<br />
13
Benelux Morning Notes 26 April 2013<br />
Maintained<br />
Hold<br />
Price (25/04/13) €12.00<br />
Maintained<br />
Target price (12m) €14.60<br />
Forecast total return 21.7%<br />
Market cap<br />
Bloomberg<br />
€470.4m<br />
LANS NA<br />
Van Lanschot: 1Q13 trading update - CT1 ratio ahead, funding ratio<br />
slipped<br />
Van Lanschot released its 1Q13 trading update earlier than expected. Under the helm of<br />
new CEO, Karl Guha, Van Lanschot (VLS) is undertaking a strategic review. Originally<br />
the trading update release was planned at May 14, the day of the AGM and presentation<br />
of the outcome of strategic plan. VLS decided to sepreate the events and brought <strong>for</strong>ward<br />
the release.<br />
Net reported profit came in at €24.8m (1Q12: €16.8m) with underlying net profit at<br />
€26.3m (1Q12: €15.2m). This is much better than we had expected, but in our view to<br />
large extent driven by realized gains. That said, the cost base and commission income<br />
are heading in the right direction as well.<br />
Total income came in at €150.2m (4Q12: €123.1m, 1Q12: €137.7m). The QoQ<br />
increase seems driven by realized capital gains on bonds and increased commission<br />
income. In our view net interest income (not disclosed) is flat to slightly down as repricing<br />
of loans lags.<br />
Costs went down 5.2% QoQ, to €95.3m, highlighting the impact of the cost reduction<br />
programme.<br />
Loan losses fell QoQ, from €47.4m to €19.7m, and up slightly YoY (1Q12: €16.8m).<br />
For FY13 we <strong>for</strong>ecast €100m, hence 1Q13 came in below this run-rate annualized.<br />
No update provided on NPL and coverage ratio development.<br />
The Core Tier 1 ratio came in at 11.9% (+90bp QoQ). The increase reflects the 1Q13<br />
profit and reduction in RWA, which we estimate at 4-5% QoQ to c.€10bn. The decline<br />
in RWA is ahead of our expectations, and a positive development as VLS aim to<br />
trans<strong>for</strong>m to a more asset-light private banking model. We <strong>for</strong>ecast a CT1 ratio if<br />
10.7% (pre IAS19: 11.5%) <strong>for</strong> FY14. However we understand the IAS19 pension<br />
charge is postponed until January 2014 and will be phased-in. In our <strong>for</strong>ecast we had<br />
assumed an impact of c.79bps as of January 2013.<br />
The funding ratio slipped from 84.4% to 83.1%, highlighting that the outflow of savings<br />
still surpassed the decline in the loan portfolio. Total savings balances amounted to<br />
€11.4bn at the end of 2012. Total client assets increased to €53bn from €52.3bn,<br />
supported by increased AUM compensating lower savings balances.<br />
We await the outcome of the strategic review. In our view, the new CEO’s mandate is to<br />
trans<strong>for</strong>m VLS into a fully focused independent private bank with a sustainable level of<br />
profitability (return ≥12% <strong>ING</strong>F). We believe that this means a transition to an asset-light<br />
model and structurally addressing the cost base to improve efficiency. For now, we<br />
remain cautious and maintain our HOLD recommendation Main risks: (1) outcome of<br />
strategic review (one-off costs, acceleration of run-down of loan book could crystallise<br />
losses); (2) level of interest rates; (3) property price developments (CRE portfolio:<br />
€2.4bn); (4) general financial market sentiment, and (5) credit rating downgrade.<br />
Albert Ploegh, Amsterdam +31 20 563 8748<br />
14
Benelux Morning Notes 26 April 2013<br />
Maintained<br />
Hold<br />
Price (25/04/13) €2.33<br />
Maintained<br />
Target price (12m) €2.30<br />
Forecast total return 1.7%<br />
Market cap<br />
Bloomberg<br />
€175.3m<br />
WES NA<br />
Wessanen: reasonable 1Q13 - margins improving, net debt higher<br />
Wessanen reported autonomous growth of -1.0% in 1Q13, with group sales of €172.5m<br />
slightly below consensus at €175m. EBIT (be<strong>for</strong>e exceptional) came in at €9.3m, better<br />
than consensus at €4.5m. Net Debt is higher, at €62.7m compared to €50.5m expected<br />
by consensus. ABC remains weak in the run-up to the important summer season, at -<br />
9.9% to €22.5m.<br />
Wessanen 1Q13<br />
Sales<br />
EBIT<br />
consensus Actual consensus Actual<br />
Grocery 73.2 70.9<br />
HFS 51.3 52.8<br />
IZICO 27.6 28.2<br />
ABC 25.2 22.5<br />
Group 175 172.5 4.5 9.3<br />
Source: Company data, <strong>ING</strong> estimates<br />
Main points from the results:<br />
1. Net Debt increased by more than expected to €62.7m, from €54.9m in 1Q12<br />
(consensus expectations: €50.5m). This was mainly related due to seasonal<br />
outflow of working capital and additional inventory build-up at IZICO ahead of<br />
the closure of the Deurne plant.<br />
2. Grocery was a touch below, with volumes flat and pricing up 1.6%. Lower<br />
private label sales in Italy and the UK reduced sales by c.2%. Operating results<br />
clearly improved due to changes made in Germany and Italy<br />
3. HFS posted a 1.5% autonomous decline, witnessing slightly improving trends<br />
driven by France.<br />
4. ABC posted a revenue decline of 9.9% due to weak market trends. Wessanen<br />
market share remained stable. Daily’s introduced six new flavours and is now up<br />
to 13 flavours ahead of the important summer season.<br />
There is a conference call starting at 10.00 CET, +31 20 794 8504<br />
Marco Gulpers, Amsterdam +31 20 563 8758<br />
15
Benelux Morning Notes 26 April 2013<br />
Macro news<br />
US: 1Q13 GDP preview…<br />
…should be relatively good (close to 3.0%), but 2Q13 likely to be much weaker.<br />
1Q13 GDP growth <strong>for</strong> the US should be relatively good (<strong>ING</strong>f = 3.2%), despite the recent<br />
slump in activity data. Strong per<strong>for</strong>mances in January and February mean that even with<br />
the March slump, the quarter as a whole should be pretty good.<br />
An example of this is consumer spending, where we have strong growth in January and<br />
February, so even if we have a 0.1ppt decline in March, 1Q13 consumer spending growth<br />
will still manage close to a 3.0% annualised growth rate.<br />
Fig 1 Consumer spending<br />
Fig 2 Business investment eqpt and software)<br />
3m/3m annualised<br />
4.5<br />
mom%<br />
0.6<br />
% %<br />
30<br />
40<br />
4.0<br />
3.5<br />
3.0<br />
2.5<br />
2.0<br />
1.5<br />
1.0<br />
0.5<br />
Real consumer<br />
spending, lhs<br />
Mom%, rhs<br />
f'cast<br />
0.0<br />
Jan-10 Jul-10 Jan-11 Jul-11 Jan-12 Jul-12 Jan-13<br />
Source: EcoWin, <strong>ING</strong><br />
0.5<br />
0.4<br />
0.3<br />
0.2<br />
0.1<br />
0.0<br />
-0.1<br />
-0.2<br />
-0.3<br />
20<br />
10<br />
0<br />
-10<br />
-20<br />
-20<br />
-30<br />
-30<br />
Eqpt and s'ware, QoQ ann,<br />
lhs<br />
-40<br />
Shipments, QoQ ann, rhs<br />
-40<br />
-50<br />
New orders, QoQ ann, rhs<br />
-50<br />
-60<br />
99 00 01 02 03 04 05 06 07 08 09 10 11 12 13<br />
Source: EcoWin, <strong>ING</strong><br />
30<br />
20<br />
10<br />
0<br />
-10<br />
Disappointing durable goods orders data this week will also likely still leave business<br />
investment on equipment and software growing at an 8% rate – slower than 4Q12, but<br />
not bad under the circumstances.<br />
Add to this some payback from dismal government spending in 4Q12 (though this is<br />
probably strongly tempered by defence procurement postponements given the fiscal<br />
uncertainty) and a strong residential investment backdrop. In fact, it is only some possible<br />
further slippage in inventories, and some drag from net exports (both very hard to<br />
<strong>for</strong>ecast with any accuracy given only partial quarterly data) that we might expect the<br />
overall figure to be as low as 3.0%, and not considerably higher.<br />
However, the real story is not 1Q13 GDP, but 2Q13 and 3Q13, and here, the run of<br />
recent data is hinting at something much softer, perhaps even a negative figure. It is this<br />
coming data, not today’s GDP, that will determine the timing of any scaling back in the<br />
Fed’s QE programme. Until recently, there had been a lot of talk of a 3Q12 scaling back.<br />
We think this is too soon, but the mid-2014 view that seems to be settling into the<br />
consensus also seems to us to be too late, given that the soft-patch is likely to be<br />
temporary, and data from the middle of the year on is likely to be stronger.<br />
Consequently, any spike up in Treasury yields on the back of today’s strong-looking GDP<br />
data is unlikely to last more than a short time be<strong>for</strong>e the weaker data overwhelms market<br />
sentiment again. Though by the year end, we should have re-tested, and probably<br />
pushed through March Treasury yield highs again. It’s going to be choppy!<br />
rob.carnell@uk.ing.com<br />
16
Benelux Morning Notes 26 April 2013<br />
UK: 1Q13 GDP rises 0.3% QoQ…<br />
…take that, IMF!<br />
Following the recent spat with the IMF over the UK’s austerity plans, Chancellor George<br />
Osborne can allow himself a moment of smugness following a much better than expected<br />
0.3% increase in GDP in 1Q13. This is all the more encouraging because awful weather<br />
in the first quarter might have been expected to deliver a weaker result.<br />
Admittedly, these preliminary figures are based on scant real data, and are subject to<br />
average revisions of around 0.4% QoQ, so it may turn out that despite this, the UK really<br />
is in its third technical recession after all the revisions are through. But hopefully this will<br />
not be the case, and we can look <strong>for</strong>ward to some more growth in the quarters ahead as<br />
the funding <strong>for</strong> lending scheme helps re-invigorate both mortgage lending and SME<br />
lending.<br />
Fig 3 UK GDP growth<br />
QoQ%<br />
1.5<br />
YoY%<br />
6.0<br />
1.0<br />
4.0<br />
0.5<br />
2.0<br />
0.0<br />
-0.5<br />
-1.0<br />
0.0<br />
-2.0<br />
-1.5<br />
QoQ%, lhs<br />
YoY%, rhs<br />
-4.0<br />
-2.0<br />
-6.0<br />
-2.5<br />
2007 2009 2011 2013<br />
-8.0<br />
Source: EcoWin<br />
Output strength was concentrated in the service sector, which still accounts <strong>for</strong> the bulk of<br />
the UK’s output. This grew at a 0.6% rate, with transport and communications growing<br />
1.4% QoQ, business services and finance a disappointing 0.2%, and government and<br />
other services 0.5%.<br />
Manufacturing in contrast fell by 0.3%, though as the ONS points out, most of this decline<br />
was concentrated in January and February, so we might expect this to per<strong>for</strong>m better in<br />
2Q13. Construction was also very weak, but is likely to have been heavily affected by bad<br />
weather in 1Q13, so we may also expect this to rise in 2Q13.<br />
This better UK data is “one in the eye” <strong>for</strong> the IMF, which recently and publically criticised<br />
the UK government’s deficit reduction approach, and is also a thumb to the nose <strong>for</strong> the<br />
ratings agencies, which have largely blamed the UK’s growth per<strong>for</strong>mance <strong>for</strong> recent<br />
downgrades. We do not expect this GDP result to let the Bank of England off the hook.<br />
There is clearly still work to be done. The economy’s recovery path is still very shallow.<br />
But this release might delay any further increase in the asset purchase scheme, though<br />
we still expect more QE in the months ahead.<br />
rob.carnell@uk.ing.com<br />
17
Benelux Morning Notes 26 April 2013<br />
France: French unemployment hits record high<br />
Yesterday’s unemployment figures confirmed that it will take more than the current<br />
plans <strong>for</strong> the French government to succeed in reversing the trend. These figures<br />
also point to a weaker consumer confidence in April (data released this morning)<br />
and to further private consumption contraction in the first quarter of the year.<br />
The number of unemployed working age workers in March saw its 23 rd consecutive<br />
increase, rising above the 3.2 million threshold (3.225m), thereby beating the old record<br />
of the late 1990s. The first quarter of 2013 saw an increase of nearly 100K unemployed,<br />
31.5% more than in the fourth quarter of 2012 (75K). In this context, it is no surprise that<br />
consumer confidence decreased again in March as the main INSEE indicator showed.<br />
This morning, the April figure is unlikely to be better.<br />
Confidence was almost unchanged in the first quarter compared to the last quarter of<br />
2012, pointing to further private consumption contraction in the beginning of the year.<br />
That said, another survey brought some hope of a future end to the unemployment spiral:<br />
the service PMI indicator stopped decreasing in April, rebounding from 41.3 to 44.1. To<br />
be sure, this level remains very weak and still points to contracting activity, but if this<br />
trend is confirmed in the next months, unemployment might peak at the turn of the year.<br />
Fig 4 Unemployment is unlikely to decrease be<strong>for</strong>e the<br />
end of the year…<br />
Fig 5 … decreasing the likelihood of a positive GDP<br />
growth figure <strong>for</strong> 2013<br />
65<br />
6<br />
11<br />
-5<br />
60<br />
55<br />
50<br />
45<br />
7<br />
8<br />
9<br />
10<br />
11<br />
10.5<br />
10<br />
9.5<br />
9<br />
8.5<br />
8<br />
7.5<br />
7<br />
6.5<br />
-4<br />
-3<br />
-2<br />
-1<br />
0<br />
1<br />
2<br />
3<br />
40<br />
06 07 08 09 10 11 12 13<br />
12<br />
6<br />
04 05 06 07 08 09 10 11 12<br />
4<br />
FR PMI Services<br />
Unemployment (% - Rev.RHS)<br />
FR Unemployment (ILO %)<br />
FR GDP (% YoY - Rhs)<br />
Source: Bloomberg, Thomson Reuters<br />
Source: Thomson Reuters<br />
This morning, April consumer confidence will be released, probably showing that<br />
confidence is as low as at the end of 2011 when personal spending was contracting. All<br />
in all, April surveys are all pointing to a weak beginning of the second quarter of 2013<br />
after a first quarter that is not likely to be better than the last quarter of 2012 when the<br />
economy contracted. There<strong>for</strong>e, it becomes hard to believe in a positive GDP growth<br />
figure <strong>for</strong> 2013. At a time when France seems to bury itself in recession, there is clearly a<br />
need to go further on the path of structural re<strong>for</strong>ms, <strong>for</strong> the sake of future employment.<br />
However, current figures might increase the French government’s ef<strong>for</strong>ts to stop the<br />
European emphasis on austerity, while at the same time pleading <strong>for</strong> more monetary<br />
easing.<br />
julien.manceaux@ing.be<br />
18
Benelux Morning Notes 26 April 2013<br />
Contacts<br />
Benelux research contacts<br />
Head of Benelux equity research<br />
Marco Gulpers 31 20 563 8758<br />
Sector contacts<br />
Marco Gulpers Food, Beverages, Retail 31 20 563 8758<br />
Filip De Pauw Chemicals, Metals 32 2 547 6097<br />
Marc Zwartsenburg Staffing, Industrials, Technology 31 20 563 8721<br />
Albert Ploegh Financials 31 20 563 8748<br />
Fabian Smeets Chemicals, Media 31 20 563 8490<br />
Jaap Kuin Real estate 31 20 563 8780<br />
Tijs Hollestelle Construction, Industrials 31 20 563 8789<br />
Quirijn Mulder Oil services, Shipping, Engineering 31 20 563 8757<br />
Emmanuel Carlier Telecom, Industrials 32 2 547 7534<br />
Matthiaus Maenhaut Belgian small caps, Holding companies 32 2 547 7523<br />
Economics research<br />
Mark Cliffe Global Head of Financial Markets research 44 20 7767 6283<br />
Rob Carnell Global, Chief International Economist 44 20 7767 6909<br />
Peter Vanden Houte Belgium, Eurozone 32 2 547 8009<br />
Martin van Vliet Eurozone 31 20 563 9528<br />
Carsten Brzeski Germany, Eurozone 32 2 547 8652<br />
Paolo Pizzoli EMU, Italy, Greece 39 02 89629 3630<br />
Maarten Leen Netherlands 31 20 563 4406<br />
Dimitry Fleming Netherlands 31 20 563 9497<br />
Julien Manceaux Switzerland 32 2 547 3350<br />
James Knightley UK, US, US$ Bloc 44 20 7767 6614<br />
Sales desks<br />
Amsterdam 31 20 563 2121<br />
Brussels 32 2 547 1377<br />
New York 1 646 424 6036<br />
19
Benelux Morning Notes 26 April 2013<br />
Disclosures Appendix<br />
ANALYST CERTIFICATION<br />
The analyst(s) who prepared this report hereby certifies that the views expressed in this report accurately reflect his/her<br />
personal views about the subject securities or issuers and no part of his/her compensation was, is, or will be directly or<br />
indirectly related to the inclusion of specific recommendations or views in this report.<br />
IMPORTANT DISCLOSURES<br />
Company disclosures and ratings charts are available from the disclosures page on our website at<br />
http://research.ing.com or write to The Compliance Department, <strong>ING</strong> Financial Markets LLC, 1325 Avenue of the<br />
Americas, New York, USA, 10019.<br />
Valuation and risks: For details of the valuation methodologies used to determine our price targets and risks related to the<br />
achievement of these targets refer to the main body of this report and/or the most recent equity company report available at<br />
http://research.ing.com.<br />
The remuneration of research analysts is not tied to specific investment banking transactions per<strong>for</strong>med by <strong>ING</strong> Group<br />
although it is based in part on overall revenues, to which investment banking contribute.<br />
Securities prices: Prices are taken as of the previous day’s close on the home market unless otherwise stated.<br />
Job titles. The functional job title of the person/s responsible <strong>for</strong> the recommendations contained in this report is equity<br />
research analyst unless otherwise stated. Corporate titles may differ from functional job titles.<br />
Conflicts of interest policy. <strong>ING</strong> manages conflicts of interest arising as a result of the preparation and publication of research<br />
through its use of internal databases, notifications by the relevant employees and Chinese walls as monitored by <strong>ING</strong><br />
Compliance. For further details see our research policies page at http://research.ing.com.<br />
Research analyst(s): The research analyst(s) <strong>for</strong> this report may not be registered/qualified as a research analyst with the<br />
NYSE and/or NASD. The research analyst(s) <strong>for</strong> this report may not be an associated person of <strong>ING</strong> Financial Markets LLC<br />
and there<strong>for</strong>e may not be subject to Rule 2711 restrictions on communications with a subject company, public appearances<br />
and trading securities held by the research analyst’s account.<br />
Target prices, where included, are based on reasonable assumptions supported by objective data. Unless otherwise stated, neither<br />
historic share price per<strong>for</strong>mance data nor <strong>ING</strong> projections on potential share price per<strong>for</strong>mance reflect the impact of commissions,<br />
fees and charges. Past per<strong>for</strong>mance is not indicative of future results. Forecasts are not a reliable indicator of future per<strong>for</strong>mance.<br />
FOREIGN AFFILIATES DISCLOSURES<br />
Each <strong>ING</strong> legal entity which produces research is a subsidiary, branch or affiliate of <strong>ING</strong> Bank N.V. See back page <strong>for</strong> the<br />
addresses and primary securities regulator <strong>for</strong> each of these entities.<br />
RAT<strong>ING</strong> DISTRIBUTION (as of end 1Q13)<br />
RAT<strong>ING</strong> DEFINITIONS<br />
Equity coverage<br />
Investment Banking clients*<br />
Buy: Forecast 12-mth absolute total return greater than +15%<br />
Buy 41% 63%<br />
Hold 47% 68%<br />
Sell 12% 35%<br />
100%<br />
* Percentage of companies in each rating category that are Investment Banking<br />
clients of <strong>ING</strong> Financial Markets LLC or an affiliate.<br />
Hold: Forecast 12-mth absolute total return of +15% to -5%<br />
Sell: Forecast 12-mth absolute total return less than -5%<br />
Total return: <strong>for</strong>ecast share price appreciation to target price plus <strong>for</strong>ecast annual<br />
dividend. Price volatility and our preference <strong>for</strong> not changing recommendations too<br />
frequently means <strong>for</strong>ecast returns may fall outside of the above ranges at times.<br />
20
Benelux Morning Notes 26 April 2013<br />
AMSTERDAM BRUSSELS LONDON NEW YORK S<strong>ING</strong>APORE<br />
Tel: 31 20 563 8758 Tel: 32 2 547 7534 Tel: 44 20 7767 1000 Tel: 1 646 424 6000 Tel: 65 6535 3688<br />
Bratislava<br />
Tel: 421 2 5934 6111<br />
Bucharest<br />
Tel: 40 21 222 1600<br />
Budapest<br />
Tel: 36 1 235 8800<br />
Buenos Aires<br />
Tel: 54 11 4310 4700<br />
Dublin<br />
Tel: 353 1 638 4000<br />
Geneva<br />
Tel: 41 22 593 8050<br />
Hong Kong<br />
Tel: 852 2848 8488<br />
Istanbul<br />
Tel: 90 212 329 0752<br />
Kiev<br />
Tel: 380 44 230 3030<br />
Madrid<br />
Tel: 34 91 789 8880<br />
Manila<br />
Tel: 63 2 479 8888<br />
Mexico City<br />
Tel: 52 55 5258 2000<br />
Milan<br />
Tel: 39 02 89629 3610<br />
Moscow<br />
Tel: 7 495 755 5400<br />
Paris<br />
Tel: 33 1 56 39 32 84<br />
Prague<br />
Tel: 420 257 474 111<br />
Sao Paulo<br />
Tel: 55 11 4504 6000<br />
Seoul<br />
Tel: 82 2 317 1800<br />
Shanghai<br />
Tel: 86 21 2020 2000<br />
Sofia<br />
Tel: 359 2 917 6400<br />
Taipei<br />
Tel: 886 2 8729 7600<br />
Tokyo<br />
Tel: 81 3 3217 0301<br />
Warsaw<br />
Tel: 48 22 820 5018<br />
Research offices: legal entity/address/primary securities regulator<br />
Amsterdam <strong>ING</strong> Bank N.V., Foppingadreef 7, Amsterdam, Netherlands, 1102BD. Netherlands Authority <strong>for</strong> the Financial Markets<br />
Brussels <strong>ING</strong> Belgium S.A./N.V., Avenue Marnix 24, Brussels, Belgium, B-1000. Financial Services and Market Authority (FSMA)<br />
Bucharest <strong>ING</strong> Bank N.V. Amsterdam - Bucharest Branch, 48 Lancu de Hunedoara Bd., 011745, Bucharest 1, Romania. Romanian National<br />
Securities and Exchange Commission, Romanian National Bank<br />
Budapest <strong>ING</strong> Bank N.V. Hungary Branch, Dozsa Gyorgy ut 84\B, H - 1068 Budapest, Hungary. Hungarian Financial Supervisory Authority<br />
Istanbul <strong>ING</strong> Bank A.S., <strong>ING</strong> Bank Headquarters, Resitpasa Mahallesi Eski Buyukdere Cad. No:8, 34467 Sariyer, Istanbul , Turkey. Capital<br />
Markets Board<br />
London <strong>ING</strong> Bank N.V. London Branch, 60 London Wall, London EC2M 5TQ, United Kingdom. Authorised by the Dutch Central Bank<br />
Manila <strong>ING</strong> Bank N.V., Manila Branch, 20/F Tower One, Ayala Triangle, Ayala Avenue, 1226 Makati City, Philippines. Philippine Securities and<br />
Exchange Commission<br />
Milan <strong>ING</strong> Bank N.V. Milano, Via Paleocapa, 5, Milano, Italy, 20121. Commissione Nazionale per le Società e la Borsa<br />
Moscow <strong>ING</strong> BANK (EURASIA) ZAO, 36, Krasnoproletarskaya ulitsa, 127473 Moscow, Russia. Federal Financial Markets Service<br />
Mumbai <strong>ING</strong> Vysya Bank Limited, Plot C-12, Block-G, 7th Floor, Bandra Kurla Complex, Bandra (E), Mumbai - 400 051, India. Securities and<br />
Exchange Board of India<br />
New York <strong>ING</strong> Financial Markets LLC, 1325 Avenue of the Americas, New York, United States, 10019. Securities and Exchange Commission<br />
Singapore <strong>ING</strong> Bank N.V. Singapore Branch, 19/F Republic Plaza, 9 Raffles Place, #19-02, Singapore, 048619. Monetary Authority of Singapore<br />
Warsaw <strong>ING</strong> Securities S.A., Plac Trzech Krzyzy, 10/14, Warsaw, Poland, 00-499. Polish Financial Supervision Authority<br />
Disclaimer<br />
This report has been prepared on behalf of <strong>ING</strong> (being <strong>for</strong> this purpose the commercial banking business of <strong>ING</strong> Bank NV and certain of its subsidiary companies)<br />
solely <strong>for</strong> the in<strong>for</strong>mation of its clients. <strong>ING</strong> <strong>for</strong>ms part of <strong>ING</strong> Group (being <strong>for</strong> this purpose <strong>ING</strong> Groep NV and its subsidiary and affiliated companies). It is not<br />
investment advice or an offer or solicitation <strong>for</strong> the purchase or sale of any financial instrument. While reasonable care has been taken to ensure that the<br />
in<strong>for</strong>mation contained herein is not untrue or misleading at the time of publication, <strong>ING</strong> makes no representation that it is accurate or complete. The in<strong>for</strong>mation<br />
contained herein is subject to change without notice. <strong>ING</strong> Group and any of its officers, employees, related and discretionary accounts may, to the extent not<br />
disclosed above and to the extent permitted by law, have long or short positions or may otherwise be interested in any transactions or investments (including<br />
derivatives) referred to in this report. In addition, <strong>ING</strong> Group may provide banking, insurance or asset management services <strong>for</strong>, or solicit such business from, any<br />
company referred to in this report. Neither <strong>ING</strong> Group nor any of its officers or employees accepts any liability <strong>for</strong> any direct or consequential loss arising from any<br />
use of this report or its contents. Copyright and database rights protection exists in this report and it may not be reproduced, distributed or published by any person<br />
<strong>for</strong> any purpose without the prior express consent of <strong>ING</strong>. All rights are reserved. Any investments referred to herein may involve significant risk, are not<br />
necessarily available in all jurisdictions, may be illiquid and may not be suitable <strong>for</strong> all investors. The value of, or income from, any investments referred to herein<br />
may fluctuate and/or be affected by changes in exchange rates. Past per<strong>for</strong>mance is not indicative of future results. Investors should make their own investigations<br />
and investment decisions without relying on this report. Only investors with sufficient knowledge and experience in financial matters to evaluate the merits and risks<br />
should consider an investment in any issuer or market discussed herein and other persons should not take any action on the basis of this report. Clients should<br />
contact analysts at, and execute transactions through, an <strong>ING</strong> entity in their home jurisdiction unless governing law permits otherwise. Additional in<strong>for</strong>mation is<br />
available on request. Country-specific disclosures: EEA: This report constitutes “investment research” <strong>for</strong> the purposes of the Markets in Financial Instruments<br />
Directive and as such contains an objective or independent explanation of the matters contained herein. Any recommendations contained in this report must not be<br />
relied on as investment advice based on the recipient’s personal circumstances. If further clarification is required on words or phrases used in this report, the<br />
recipient is recommended to seek independent legal or financial advice. Hong Kong: This report is distributed in Hong Kong by <strong>ING</strong> Bank N.V., Hong Kong Branch<br />
which is licensed by the Securities and Futures Commission of Hong Kong under the Securities and Futures Ordinance (Chapter 571 of the Laws of Hong Kong)<br />
(“SFO”). This document does not constitute a solicitation or an offer of securities or an invitation to the public within the meaning of the SFO. This report is to be<br />
circulated only to “professional investors” as defined in the SFO. India: Any recipient of this report wanting additional in<strong>for</strong>mation or to effect any transaction in<br />
Indian securities or financial instruments mentioned herein must do so by contacting a representative of <strong>ING</strong> Vysya Bank Limited (“<strong>ING</strong> Vysya”) which is<br />
responsible <strong>for</strong> distribution of this report in India. <strong>ING</strong> Vysya is an affiliated company of <strong>ING</strong>. <strong>ING</strong> Vysya does not accept liability <strong>for</strong> any direct or consequential loss<br />
arising from any use of in<strong>for</strong>mation provided in this report. Italy: This report is issued in Italy only to persons described in Article No. 31 of Consob Regulation No.<br />
11522/98. Singapore: This document is provided in Singapore by or through <strong>ING</strong> Bank N.V., Singapore Branch and is provided only to accredited investors, expert<br />
investors and institutional investors, as defined in Section 4A of the Securities and Futures Act, Cap. 289. If you are an accredited investor or expert investor,<br />
please be in<strong>for</strong>med that in <strong>ING</strong>’s dealings with you, <strong>ING</strong> is relying on the following exemptions to the Financial Advisers Act, Cap. 110 (“FAA”): (1) the exemption in<br />
Regulation 33 of the Financial Advisers Regulations (“FAR”), which exempts <strong>ING</strong> from complying with Section 25 of the FAA on disclosure of product in<strong>for</strong>mation to<br />
clients; (2) the exemption set out in Regulation 34 of the FAR, which exempts <strong>ING</strong> from complying with Section 27 of the FAA on recommendations; and (3) the<br />
exemption set out in Regulation 35 of the FAR, which exempts <strong>ING</strong> from complying with Section 36 of the FAA on disclosure of certain interests in securities.<br />
United Kingdom: This report is issued in the United Kingdom by <strong>ING</strong> Bank N.V., London Branch only to persons described in Articles 19, 47 and 49 of the<br />
Financial Services and Markets Act 2000 (Financial Promotion) Order 2005 and is not intended to be distributed, directly or indirectly, to any other class of persons<br />
(including private investors). United States: Any person wishing to discuss this report or effect transactions in any security discussed herein should contact <strong>ING</strong><br />
Financial Markets LLC, which is a member of the NYSE, FINRA and SIPC and part of <strong>ING</strong>, and which has accepted responsibility <strong>for</strong> the distribution of this report<br />
in the United States under applicable requirements. The distribution of this report in other jurisdictions may be restricted by law or regulation and persons into<br />
whose possession this document comes should in<strong>for</strong>m themselves about, and observe, any such restrictions.<br />
EQ<br />
Additional in<strong>for</strong>mation is available on request<br />
21