WIND ATLAS FOR EGYPT: MEASUREMENTS, MICRO- AND ...
WIND ATLAS FOR EGYPT: MEASUREMENTS, MICRO- AND ...
WIND ATLAS FOR EGYPT: MEASUREMENTS, MICRO- AND ...

You also want an ePaper? Increase the reach of your titles
YUMPU automatically turns print PDFs into web optimized ePapers that Google loves.
OBSERVED <strong>WIND</strong> CLIMATES<br />
Meteorological observations from almost 50 stations all over Egypt have been analysed in the course of<br />
the project; of these eight standard (WMO) stations operated by the Egyptian Meteorological Authority<br />
and 22 dedicated wind atlas stations erected and operated by the project were selected for the final Atlas.<br />
The meteorological stations were chosen to cover six regions: Northwest Coast, Northeast Coast, Gulf of<br />
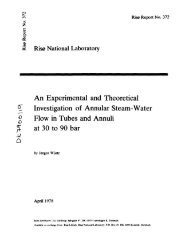
Aqaba, Gulf of Suez, Red Sea and Western Desert. Figure 1 shows an elevation map of Egypt in which<br />
the meteorological stations of the Atlas are shown.<br />
Figure 1. Elevation map of Egypt showing the meteorological stations used for the Wind Atlas for Egypt.<br />
The geographic and Cartesian (UTM) coordinates are referenced to the World Geodetic System 1984.<br />
The meteorological instrumentation used for the 22 wind atlas stations consists of a data-logger with a<br />
data storage unit, as well as sensors to measure wind speed, wind direction, air temperature, atmospheric<br />
pressure and solar radiation. The sensors and data-logger are mounted on 25-m high triangular, lattice<br />
towers. The accuracy of the wind speed measurements have been secured by individual calibration of the<br />
cup anemometers used and by careful mounting of the wind sensors: a slender top tube was employed for<br />
the top anemometer at 25 m and extension poles were used for boom-mounted sensors.<br />
The wind data recorded at the wind atlas stations are: mean wind speed, standard deviation of wind speed,<br />
gust wind speed, lull wind speed and mean wind direction. Primary measurements are done at 25 m a.g.l.<br />
and the averaging and sampling time is 10 minutes. Standard deviation is calculated from 1-Hz samples<br />
and the gust and lull wind speeds are sampled in 2-second windows over the 10-minute period.<br />
The main statistics of the observed wind climates at the 30 stations are listed in Table 1.