WIND ATLAS FOR EGYPT: MEASUREMENTS, MICRO- AND ...
WIND ATLAS FOR EGYPT: MEASUREMENTS, MICRO- AND ...
WIND ATLAS FOR EGYPT: MEASUREMENTS, MICRO- AND ...

Create successful ePaper yourself
Turn your PDF publications into a flip-book with our unique Google optimized e-Paper software.
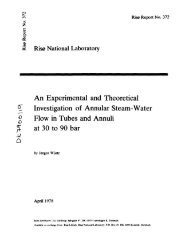
WAsP wind speed [ms -1 ]<br />
15<br />
14<br />
13<br />
12<br />
11<br />
10<br />
9<br />
8<br />
7<br />
6<br />
5<br />
4<br />
3<br />
2<br />
1<br />
0<br />
0 1 2 3 4 5 6 7 8 9 10 11 12 13 14 15<br />
NWA wind speed [ms -1 ]<br />
Kharga<br />
Dakhla South<br />
Shark El-Ouinat<br />
Asswan<br />
Abu Simbel<br />
Figure 7. Western Desert domain comparison of atlas wind speed values at 10, 25, 50, 100, 200 m<br />
calculated using KAMM/WAsP (x-axis) and observations/WAsP (y-axis), roughness is 0.03 m.<br />
The complexity of the flow modification by the topography influences the agreement between the<br />
KAMM results and the observations. For the Gulf of Suez and the Red Seas domains, the topography<br />
tends to be higher and have a stronger influence on the flow. For the Northwest Coast and Western Desert<br />
domains, the topography is less complex, and the flow modification due to terrain is less pronounced.<br />
Correct selection of the wind classes used to force the mesoscale model has a very strong influence on the<br />
accuracy of the KAMM results. The use of more location-specific wind classes in the smaller domains<br />
tends to reduce the error from this source.<br />
Other causes of error may be found within the WAsP analyses. The correct choice of surface roughness<br />
for instance has an influence on the wind atlas values. Also some of the stations are relatively close to<br />
sheltering obstacles. Obstacles can be difficult to model correctly. Comparison of the wind direction<br />
distributions also would help to highlight causes of errors, including errors due to incorrectly modelled<br />
influence of obstacles.<br />
Finally, the observed data sets have not been referenced to the same standard period of time so the scatter<br />
in Figure 6 and Figure 7 also simply reflect the climatic variability in the wind regimes.<br />
For some groups of stations, the mean speeds and power densities predicted by the mesoscale model are<br />
somewhat lower than the observed values. This is particularly obvious for the four stations in the Gulf of<br />
El-Zayt / Hurghada region, where the predictions are significantly lower than the observed values. This<br />
may be caused be the limited resolution of these mesoscale model runs.<br />
Table 2 summarises the comparisons between the KAMM- and WAsP-modelled regional wind climates.<br />
The absolute error is calculated as the difference between the two estimates (for the height of 50 m a.g.l.)<br />
divided by their mean value, and expressed as a percentage. The right-most column shows the mean<br />
absolute error for a subset of stations in the Red Sea and the Gulf of Suez. The scatter plots shown in<br />
Figure 6 and Figure 7 indicate that the largest differences between the KAMM- and WAsP-modelled<br />
regional wind climates are found for stations located close to the southern entrance of the Gulf of Suez. If<br />
Hurghada WETC and Hurghada AP are disregarded in the Red Sea comparison, the mean absolute error<br />
decreases from 10.5% to 4.4%.