WIND ATLAS FOR EGYPT: MEASUREMENTS, MICRO- AND ...
WIND ATLAS FOR EGYPT: MEASUREMENTS, MICRO- AND ...
WIND ATLAS FOR EGYPT: MEASUREMENTS, MICRO- AND ...

Create successful ePaper yourself
Turn your PDF publications into a flip-book with our unique Google optimized e-Paper software.
<strong>WIND</strong> <strong>ATLAS</strong> <strong>FOR</strong> <strong>EGYPT</strong>:<br />
<strong>MEASUREMENTS</strong>, <strong>MICRO</strong>- <strong>AND</strong> MESOSCALE MODELLING<br />
Niels G. Mortensen 1 , Jens Carsten Hansen, Jake Badger, Bo H. Jørgensen, Charlotte B. Hasager,<br />
Uwe S. Paulsen, Ole F. Hansen, Karen Enevoldsen<br />
Wind Energy Department, Risø National Laboratory, Roskilde, Denmark<br />
Laila Georgy Youssef, Usama Said Said, Ashour Abd El-Salam Moussa, Mohammad Akmal Mahmoud<br />
Wind Energy Department, New and Renewable Energy Authority, Cairo, Egypt<br />
Ahmed El Sayed Yousef, Adel Mahmoud Awad, Mahmoud Abd-El Raheem Ahmed,<br />
Mohamed A.M. Sayed, Mohamed Hussein Korany, Metwally Abd-El Baky Tarad<br />
Research Department, Egyptian Meteorological Authority, Cairo, Egypt<br />
ABSTRACT<br />
The results of a comprehensive, 8-year wind resource assessment programme in Egypt are presented. The<br />
objective has been to provide reliable and accurate wind atlas data sets for evaluating the potential wind<br />
power output from large electricity-producing wind turbine installations. The regional wind climates of<br />
Egypt have been determined by two independent methods: a traditional wind atlas based on observations<br />
from more than 30 stations all over Egypt, and a numerical wind atlas based on long-term reanalysis data<br />
and a mesoscale model (KAMM). The mean absolute error comparing the two methods is about 10% for<br />
two large-scale KAMM domains covering all of Egypt, and typically about 5% for several smaller-scale<br />
regional domains. The numerical wind atlas covers all of Egypt, whereas the meteorological stations are<br />
concentrated in six regions. The numerical wind atlas database, in combination with SRTM 3 elevation<br />
data and satellite imagery, provide the means for immediate WAsP wind resource assessments anywhere<br />
in Egypt. In addition to the very high wind resource in the Gulfs of Suez and Aqaba, the wind atlas has<br />
discovered a large region in the Western Desert with a fairly high resource – close to consumers and the<br />
electrical grid. The KAMM simulations seem to capture the main features of the wind climate of Egypt,<br />
but in regions where the horizontal wind gradients are large, the uncertainties are large as well and<br />
additional measurements are required. The results are now published in a Wind Atlas for Egypt.<br />
INTRODUCTION<br />
The wind resources of Egypt have recently been assessed by the New and Renewable Energy Authority,<br />
the Egyptian Meteorological Authority and Risø National Laboratory; the results are reported in detail in<br />
a Wind Atlas for Egypt [1]. The primary purpose of the Atlas is to provide reliable and accurate wind atlas<br />
data sets for evaluating the potential wind power output from large electricity-producing wind farms. The<br />
regional wind climates of Egypt have been determined by two independent methods: a traditional wind<br />
atlas based on observations from more than 30 stations all over Egypt, and a numerical wind atlas based<br />
on long-term reanalysis data and a mesoscale model, KAMM. The observations have been analysed using<br />
the WAsP microscale model [ 2], and the two approaches may be described in the following simple way:<br />
WAsP microscale model: Observed wind climates ⇒ Observational wind atlas<br />
KAMM mesoscale model: Simulated wind climates ⇒ Numerical wind atlas<br />
The observational wind atlas covers only those parts of Egypt where meteorological stations have been<br />
erected or exist already, whereas the numerical wind atlas covers the entire land area of Egypt – as well as<br />
offshore. The two approaches may be compared on the regional wind climate level, since the wind atlas<br />
data sets are independent of the exact measuring and modelling conditions. The purpose of the present<br />
paper is to provide an overview of the results obtained in the Wind Atlas for Egypt project, in particular a<br />
preliminary comparison of the regional wind climates derived by the observational and numerical wind<br />
atlas approaches, respectively. The work is a continuation of the work that led to the publishing of a Wind<br />
Atlas for the Gulf of Suez [ 3, 4].<br />
1 Corresponding author: Niels G. Mortensen, Wind Energy Department, P.O. Box 49, Frederiksborgvej<br />
399, 4000 Roskilde, Denmark. T (+45) 46 77 50 27, F (+45) 46 77 59 70, niels.g.mortensen@risoe.dk.
OBSERVED <strong>WIND</strong> CLIMATES<br />
Meteorological observations from almost 50 stations all over Egypt have been analysed in the course of<br />
the project; of these eight standard (WMO) stations operated by the Egyptian Meteorological Authority<br />
and 22 dedicated wind atlas stations erected and operated by the project were selected for the final Atlas.<br />
The meteorological stations were chosen to cover six regions: Northwest Coast, Northeast Coast, Gulf of<br />
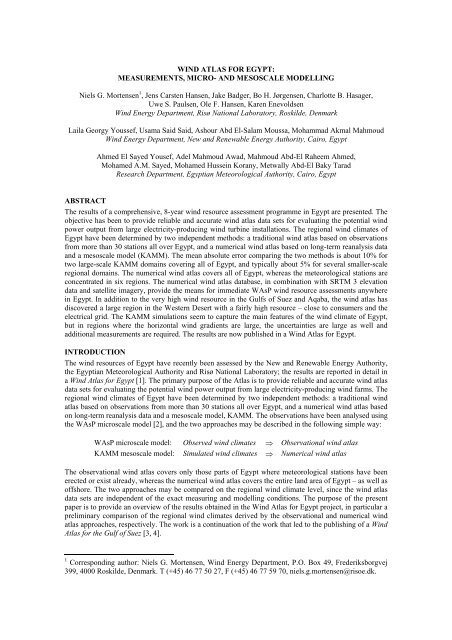
Aqaba, Gulf of Suez, Red Sea and Western Desert. Figure 1 shows an elevation map of Egypt in which<br />
the meteorological stations of the Atlas are shown.<br />
Figure 1. Elevation map of Egypt showing the meteorological stations used for the Wind Atlas for Egypt.<br />
The geographic and Cartesian (UTM) coordinates are referenced to the World Geodetic System 1984.<br />
The meteorological instrumentation used for the 22 wind atlas stations consists of a data-logger with a<br />
data storage unit, as well as sensors to measure wind speed, wind direction, air temperature, atmospheric<br />
pressure and solar radiation. The sensors and data-logger are mounted on 25-m high triangular, lattice<br />
towers. The accuracy of the wind speed measurements have been secured by individual calibration of the<br />
cup anemometers used and by careful mounting of the wind sensors: a slender top tube was employed for<br />
the top anemometer at 25 m and extension poles were used for boom-mounted sensors.<br />
The wind data recorded at the wind atlas stations are: mean wind speed, standard deviation of wind speed,<br />
gust wind speed, lull wind speed and mean wind direction. Primary measurements are done at 25 m a.g.l.<br />
and the averaging and sampling time is 10 minutes. Standard deviation is calculated from 1-Hz samples<br />
and the gust and lull wind speeds are sampled in 2-second windows over the 10-minute period.<br />
The main statistics of the observed wind climates at the 30 stations are listed in Table 1.
Table 1. Summary of wind observations at the meteorological stations: Data-collecting period, height<br />
above ground level of anemometer, data recovery rate (R), Weibull A- and k-parameters, mean wind<br />
speed (U), mean power density (E), and direction (D U ) and magnitude (|U|) of the mean wind vector.<br />
Region/Station Period Height R A k U E D U |U|<br />
[m] [%] [ms -1 ] [ms -1 ] [Wm -2 ] [deg] [ms -1 ]<br />
Northwest Coast<br />
Sidi Barrani (62301) 10 y 10.0 n/a 7.0 2.16 6.2 254 324 2.8<br />
El-Mathany 1 y 24.5 99.5 6.4 2.33 5.7 190 284 2.0<br />
Ras El-Hekma 1 y 24.5 99.8 7.2 2.23 6.4 275 309 3.1<br />
El-Galala 1 y 24.5 97.2 6.7 2.41 5.9 206 324 2.6<br />
Alexandria (62318) 10 y 10.0 n/a 5.2 2.42 4.6 99 329 2.9<br />
Northeast Coast<br />
Port Said 1 y 24.5 66.2 5.3 2.32 4.7 105 301 1.6<br />
El Arish (62337) 10 y 8.5 n/a 3.0 1.44 2.8 37 303 1.0<br />
Gulf of Aqaba<br />
Nuweiba 1 y 24.5 80.9 6.2 2.58 5.6 161 027 4.0<br />
Nabq 1 y 24.5 97.6 7.7 2.04 6.8 367 009 5.9<br />
Gulf of Suez<br />
Katamaya 1 y 24.5 79.5 6.0 2.66 5.4 143 357 2.8<br />
El-Suez (62450) 10 y 10.0 n/a 6.2 3.17 5.5 140 350 3.9<br />
Ras Sedr 5 y 24.5 84.1 8.5 3.06 7.6 368 341 6.0<br />
Abu Darag NW 3 y 47.5 82.3 9.6 3.34 8.6 519 352 6.9<br />
Abu Darag 14 y 24.5 82.5 10.1 3.50 9.1 598 355 7.6<br />
Zafarana M7 7 y 47.5 79.1 11.1 3.57 10.0 788 356 8.4<br />
Zafarana 14 y 24.5 85.2 10.2 3.19 9.1 626 358 7.0<br />
Saint Paul 5 y 24.5 82.7 9.4 3.25 8.5 498 332 7.0<br />
Ras Ghareb 5 y 24.5 85.5 11.0 3.40 9.9 775 322 8.7<br />
Gulf of El-Zayt NW 5 y 24.5 82.0 11.8 3.70 10.7 950 313 9.4<br />
Gulf of El-Zayt 7 y 24.5 83.8 11.5 3.29 10.3 900 322 9.0<br />
Red Sea<br />
Hurghada WETC 11 y 24.5 79.6 7.6 2.32 6.7 308 322 4.9<br />
Hurghada (62463) 10 y 10.0 n/a 7.6 2.66 6.7 285 325 5.4<br />
Kosseir (62465) 4 y 10.0 97.1 5.1 2.03 4.6 178 334 3.5<br />
Kosseir 4 y 24.5 88.7 6.5 2.32 5.8 197 321 4.3<br />
Western Desert<br />
Farafra (62423) 2 y 10.0 98.6 3.9 1.79 3.5 53 342 2.0<br />
Kharga 1 y 24.5 99.8 7.4 2.57 6.6 268 345 5.8<br />
Dakhla South 1 y 24.5 81.5 7.3 3.31 6.6 229 352 5.5<br />
Shark El-Ouinat 3 y 24.5 100.0 7.2 3.29 6.5 222 355 5.5<br />
Asswan (62414) 10 y 10.0 n/a 5.4 2.61 4.8 102 346 3.8<br />
Abu Simbel 1 y 24.5 99.9 6.4 2.76 5.7 166 356 4.8
OBSERVATIONAL <strong>WIND</strong> <strong>ATLAS</strong><br />
For each of the stations, the time-series of wind measurements was used to derive the observed wind<br />
climate statistics at the station [ 2]. In addition, accurate descriptions of each station and its surroundings<br />
were collected from elevation data, maps, satellite imagery, aerial photographs and during field trips:<br />
• land use and terrain roughness lengths (Google Earth Pro, maps, aerial photography, site visits)<br />
• nearby sheltering obstacles such as buildings (Google Earth Pro and site visits)<br />
• terrain elevation variations (Shuttle Radar Topography Mission 3 arc-sec. elevation data, digitised<br />
topographical maps)<br />
For the calculation of regional wind climates (wind atlas data sets), the station descriptions and the WAsP<br />
models were used to transform the measured data sets of wind speeds and directions from each station to<br />
what would have been measured at the location of the station if the surroundings were as follows:<br />
• flat and homogeneous terrain<br />
• no nearby obstacles<br />
• measurements had been taken at heights of 10, 25, 50, 100, and 200 m a.g.l.<br />
As an example, one of the transformed data sets represents wind speed and direction distributions at 50<br />
meters above roughness class 1 (z 0 = 0.03 m), see Figure 2.<br />
900<br />
k=2<br />
k=3<br />
k=4<br />
800<br />
700<br />
Wind Atlas for Egypt<br />
Gulf of El-Zayt NW<br />
Ras Ghareb<br />
Gulf of El-Zayt<br />
Power density [Wm -2 ]<br />
600<br />
500<br />
400<br />
300<br />
200<br />
100<br />
Zafarana<br />
Abu Darag<br />
Saint Paul<br />
Zafarana M7<br />
Abu Darag NW<br />
Nabq<br />
Ras Sedr<br />
Sidi Barrani<br />
El Arish<br />
Hurghada AP<br />
El-Mathany<br />
Hurghada WETC<br />
Ras El-Hekma<br />
Kharga<br />
El-Galala<br />
Kosseir Asswan<br />
Alexandria<br />
Abu Simbel Dakhla South<br />
Kosseir (62465) Shark El-Ouinat<br />
Katamaya<br />
Farafra Nuweiba<br />
4 5 6 7 8 9 10 11<br />
Wind speed [ms -1 ]<br />
Figure 2. Mean wind speeds and power densities at a height of 50 m over roughness class 1 (z 0 = 0.03 m)<br />
for the 30 stations in the Wind Atlas for Egypt. Curves represent equal Weibull k-parameters.<br />
The wind resources vary significantly over the land area of Egypt, from fairly low values at the Northeast<br />
Coast and parts of the Western Desert to the extraordinary high values found in the Gulf of Suez.
KAMM SIMULATED <strong>WIND</strong> CLIMATES<br />
As described above, the conventional method employed to produce estimates of the wind resource on a<br />
national scale is to analyse wind measurements made at a number of sites around the country. In order for<br />
this method to work there needs to be a sufficient quantity of high quality data, covering the entire<br />
country. It is not possible to satisfy this criterion for Egypt and therefore other methods are required.<br />
Numerical wind atlas methodologies have been devised to solve the issue of insufficient wind measurements.<br />
For Egypt, we have applied the KAMM/WAsP method developed at Risø National Laboratory [ 5,<br />
6]. In this methodology an approach called statistical-dynamical downscaling is used [ 7]. The basis for<br />
the method is that there is a robust relationship between meteorological situations at the large scale and<br />
meteorological situations at the small scale. This method may not meet bankable accuracy in resource<br />
estimates, but on the other hand will typically give good indications of the geographical distribution and<br />
magnitude of the wind resource. It is also useful for decision making, planning of feasibility studies and<br />
for actual project preparation.<br />
Information about the long-term, large-scale meteorological situation over Egypt was obtained from the<br />
NCEP/NCAR reanalysis data-set [ 8]. Time-series data of wind and temperature profiles for the period<br />
1965 to 1998 were used to create around 100 different large-scale wind situations or wind classes. These<br />
wind classes form a representative set of wind conditions for the region and represent different wind<br />
speeds, wind directions, atmospheric stability or shear.<br />
In order to make these wind classes meaningful at a smaller scale, a mesoscale model is used to find out<br />
how the large-scale wind forcing is modified by regional-scale topography. Therefore, a mesoscale model<br />
simulation is performed for each wind class using the Karlsruhe Atmospheric Mesoscale Model [ 9, 10].<br />
Data concerning terrain surface elevation and land-use (roughness length) were obtained from United<br />
States Geological Survey GTOPO30 global elevation data set [ 11] and Global Land Cover Classification<br />
[ 12], respectively. Egypt’s large size means that it is not possible to perform the numerical wind atlas<br />
calculations for the whole country at a reasonable resolution in one go. Therefore it was decided to split<br />
the numerical wind atlas effort into several calculation domains, see Figure 3.<br />
Latitude N<br />
32<br />
30<br />
28<br />
26<br />
Ras El-Hekma<br />
El-Mathany<br />
El-Galala<br />
Kharga<br />
Port Said<br />
Katamya<br />
Ras Sedr<br />
Abu Darag<br />
ZafaranaNuweiba<br />
Saint Paul<br />
Ras Ghareb<br />
El-Zayt NW Nabq<br />
El-Zayt<br />
Hurghada<br />
Kosseir<br />
24<br />
Dakhla South<br />
22<br />
Shark-El-Ouinat<br />
Abu Simbel<br />
26 28 30 32 34 36<br />
Longitude E<br />
Figure 3. Map of Egypt showing the various modelling domains being used. A complete numerical wind<br />
atlas calculation is made for each domain. Horizontal grid point resolution is 7.5 km for the two large<br />
domains and 5 km for the Red Sea, Western Desert, Northwest Coast and Gulf of Suez domains.
NUMERICAL <strong>WIND</strong> <strong>ATLAS</strong><br />
After the mesoscale simulations are complete for all of the wind classes, the results are compiled in the<br />
post-processing stage of the methodology. First, a weighted mean of the wind class simulation results is<br />
calculated. This yields a simulated wind resource map at the resolution of the model simulations, as the<br />
one depicted in Figure 4.<br />
Figure 4. The predicted wind climate of Egypt determined by mesoscale modelling. Map colours show<br />
mean wind speeds in [ms -1 ] at a height of 50 m over the actual (model) land surface: blue 4-5, cyan 5-6,<br />
green 6-7, yellow 7-8, red 8-9, magenta 9-10 ms -1 . The horizontal grid point resolution is 7.5 km.<br />
Second, for each wind class simulation, the effects of elevation and roughness variation are removed with<br />
modules similar to those used in the WAsP software – corresponding to a ‘WAsP analysis’ procedure<br />
where the simulated wind climate is substituted for the observed wind climate. Then the weighted mean<br />
of the adjusted results from the wind simulations is made. This yields the regional wind climates, or<br />
generalized wind map for flat, uniform surface conditions of a specified roughness. Figure 5 shows a<br />
schematic diagram of the wind class simulations and the post-processing steps.<br />
Figure 5. A schematic diagram showing the KAMM/WAsP numerical wind atlas methodology.
The regional wind climate estimates determined for the KAMM model grid points together form a database<br />
of regional wind climates covering the entire land area of Egypt. Files containing detailed information<br />
about the wind speed and direction distributions can be generated that are directly compatible with<br />
the WAsP software, the wind industry standard for site resource assessment calculations. More than<br />
50,000 WAsP regional wind climates (*.lib files) have been generated in this way to cover all of Egypt.<br />
VERIFICATION OF THE <strong>WIND</strong> <strong>ATLAS</strong> METHODOLOGY<br />
In this section a comparison is made between the wind atlas wind speed values derived from the numerical<br />
wind atlas (KAMM/WAsP method) and the observational wind atlas (WAsP method using observations).<br />
For a given location, a wind atlas file can be used to provide an expected wind speed for a set of<br />
standard heights above a set of standard terrain roughnesses.<br />
In Figure 6 and Figure 7 the mean wind speeds at 10, 25, 50, 100 and 200 m above a flat, uniform terrain<br />
surface with a roughness length z 0 of 0.03 m are used for the comparison; more comparisons are given in<br />
[ 1]. The legend to the right of each plot shows the names of the stations used, cf. Figure 1. Each figure<br />
shows the comparison within a single modelling domain; Figure 6 for the large Eastern Egypt modelling<br />
domain and Figure 7 for the smaller Western Desert domain. There is overlap of domains and therefore a<br />
few stations may appear in both plots. Where there is good agreement between KAMM/WAsP and<br />
observation and WAsP, the plotted points lie close to the one-to-one line in each plot.<br />
15<br />
14<br />
WAsP wind speed [ms -1 ]<br />
13<br />
12<br />
11<br />
10<br />
9<br />
8<br />
7<br />
6<br />
5<br />
4<br />
3<br />
2<br />
1<br />
0<br />
0 1 2 3 4 5 6 7 8 9 10 11 12 13 14 15<br />
NWA wind speed [ms -1 ]<br />
El Arish<br />
Nuweiba<br />
Nabq<br />
Katamaya<br />
Ras Sedr<br />
Abu Darag NW<br />
Abu Darag<br />
Zafarana M7<br />
Zafarana<br />
St. Paul<br />
Ras Ghareb<br />
Gulf of El-Zayt NW<br />
Gulf of El-Zayt<br />
Hurghada WETC<br />
Hurghada AP<br />
Kosseir (EMA)<br />
Kosseir<br />
Asswan<br />
Abu Simbel<br />
Figure 6. Eastern Egypt domain comparison of atlas wind speed values at 10, 25, 50, 100, 200 m calculated<br />
using KAMM/WAsP (x-axis) and observations/WAsP (y-axis), roughness is 0.03 m.<br />
In many cases there is good agreement between the wind atlases derived from KAMM modelling and<br />
observations. The agreement at the station locations adds confidence to the KAMM-derived wind data for<br />
locations away from stations.<br />
There are several possibilities why there may be poorer agreement between KAMM- and observationderived<br />
wind atlases.<br />
Close to the KAMM domain boundaries a less accurate wind atlas is usually derived. This is an unavoidable<br />
consequence of limited area modelling. The effect can be minimized by careful selection of the<br />
domain, keeping points of interest well within the domain and including the dominant topographic<br />
features in the domain as much as possible.
WAsP wind speed [ms -1 ]<br />
15<br />
14<br />
13<br />
12<br />
11<br />
10<br />
9<br />
8<br />
7<br />
6<br />
5<br />
4<br />
3<br />
2<br />
1<br />
0<br />
0 1 2 3 4 5 6 7 8 9 10 11 12 13 14 15<br />
NWA wind speed [ms -1 ]<br />
Kharga<br />
Dakhla South<br />
Shark El-Ouinat<br />
Asswan<br />
Abu Simbel<br />
Figure 7. Western Desert domain comparison of atlas wind speed values at 10, 25, 50, 100, 200 m<br />
calculated using KAMM/WAsP (x-axis) and observations/WAsP (y-axis), roughness is 0.03 m.<br />
The complexity of the flow modification by the topography influences the agreement between the<br />
KAMM results and the observations. For the Gulf of Suez and the Red Seas domains, the topography<br />
tends to be higher and have a stronger influence on the flow. For the Northwest Coast and Western Desert<br />
domains, the topography is less complex, and the flow modification due to terrain is less pronounced.<br />
Correct selection of the wind classes used to force the mesoscale model has a very strong influence on the<br />
accuracy of the KAMM results. The use of more location-specific wind classes in the smaller domains<br />
tends to reduce the error from this source.<br />
Other causes of error may be found within the WAsP analyses. The correct choice of surface roughness<br />
for instance has an influence on the wind atlas values. Also some of the stations are relatively close to<br />
sheltering obstacles. Obstacles can be difficult to model correctly. Comparison of the wind direction<br />
distributions also would help to highlight causes of errors, including errors due to incorrectly modelled<br />
influence of obstacles.<br />
Finally, the observed data sets have not been referenced to the same standard period of time so the scatter<br />
in Figure 6 and Figure 7 also simply reflect the climatic variability in the wind regimes.<br />
For some groups of stations, the mean speeds and power densities predicted by the mesoscale model are<br />
somewhat lower than the observed values. This is particularly obvious for the four stations in the Gulf of<br />
El-Zayt / Hurghada region, where the predictions are significantly lower than the observed values. This<br />
may be caused be the limited resolution of these mesoscale model runs.<br />
Table 2 summarises the comparisons between the KAMM- and WAsP-modelled regional wind climates.<br />
The absolute error is calculated as the difference between the two estimates (for the height of 50 m a.g.l.)<br />
divided by their mean value, and expressed as a percentage. The right-most column shows the mean<br />
absolute error for a subset of stations in the Red Sea and the Gulf of Suez. The scatter plots shown in<br />
Figure 6 and Figure 7 indicate that the largest differences between the KAMM- and WAsP-modelled<br />
regional wind climates are found for stations located close to the southern entrance of the Gulf of Suez. If<br />
Hurghada WETC and Hurghada AP are disregarded in the Red Sea comparison, the mean absolute error<br />
decreases from 10.5% to 4.4%.
Table 2. Comparison of atlas wind speed values at 50 m a.g.l. and a roughness of 0.03 m, calculated using<br />
KAMM/WAsP and observations/WAsP.<br />
Domain Grid size Mean absolute error Mean absolute error<br />
All stations Selected stations<br />
[km] [%] [%]<br />
Western Egypt 7.5 12.4 n/a<br />
Eastern Egypt 7.5 7.6 n/a<br />
Northwest Coast 5.0 5.2 n/a<br />
Western Desert 5.0 3.1 n/a<br />
Gulf of Suez 5.0 9.4 5.6<br />
Red Sea 5.0 10.5 4.4<br />
Likewise, if the Gulf of El-Zayt NW and Gulf of El-Zayt stations are disregarded in the Gulf of Suez<br />
comparison, the mean absolute error decreases from 9.4% to 5.6%. The typical mean absolute error is<br />
then about 10% for the large domains and about 5% for the small domains.<br />
SUMMARY <strong>AND</strong> CONCLUSIONS<br />
The Wind Atlas for Egypt project has established and operated a comprehensive network of windmonitoring<br />
stations in six designated regions all over Egypt. A database of high-quality, reliable wind<br />
measurements now exists, and new information on turbulence intensity, gust wind speeds, lull wind<br />
speeds, atmospheric pressure and solar insolation has been obtained [ 1]. The main result of the measurement<br />
campaign is an observational wind atlas which covers some of the most promising regions for wind<br />
power exploitation in Egypt. A successful continuation of the measurement programme has been secured<br />
by establishing a cup anemometer rehabilitation and recalibration facility in Egypt; the characteristics of<br />
this facility and the results obtained will be reported elsewhere.<br />
The wind climate and wind energy resources of Egypt have furthermore been determined by applying the<br />
KAMM mesoscale modelling in two large and four regional domains. New wind resource maps for Egypt<br />
have been established which correct and update our knowledge about the wind resources of the country.<br />
The KAMM simulations capture the main features of the sometimes complicated flow patterns and of the<br />
observed wind climates; however, the mean wind speeds and power densities are underestimated in some<br />
regions. The main result of the mesoscale modelling is a numerical wind atlas which covers the entire<br />
land area of Egypt as well as adjacent offshore areas.<br />
The Wind Atlas for Egypt confirms the existence of a widespread and particularly high wind resource<br />
along the Gulf of Suez. The Wind Atlas further indicates that the wind energy resource in large regions of<br />
the Western and Eastern Desert – in particular west and east of the Nile valley between 27°N and 29°N,<br />
but also north and west of the city of Kharga – are much higher than hitherto assumed. The mean wind<br />
speeds predicted here are between 7 and 8 ms -1 and the power densities between 300 and 400 Wm -2 ,<br />
estimated at a height of 50 m a.g.l. There are no meteorological stations for verification in these regions;<br />
however, comparisons elsewhere in the Western Desert of predictions derived from the mesoscale<br />
modelling to those derived from measurements suggest that the mesoscale model is indeed able to resolve<br />
and predict the wind resource in this type of terrain.<br />
The Wind Atlas for Egypt represents a significant step forward in the application of the wind atlas<br />
methodology in Egypt. Not only does it provide a coherent and consistent overview of the wind energy<br />
resource over the entire land (and sea) area of Egypt, the results of the mesoscale modelling are further<br />
available in a database (numerical wind atlas) that may be employed directly for detailed wind resource<br />
assessments and siting of wind turbines and wind farms. Utilising this database together with elevation<br />
maps derived from the Space Shuttle Topography Mission and land-use maps constructed from satellite<br />
imagery, the wind resource and likely power production of a given wind farm can be estimated in a matter<br />
of hours – anywhere in Egypt.
The project results are available in the Wind Atlas for Egypt – Measurements and Modelling 1991-2005<br />
[ 1]. In addition to the 258-page book, a comprehensive database of observed and regional wind climates<br />
is also available.<br />
ACKNOWLEDGEMENTS<br />
The Wind Atlas for Egypt is a result of the Egyptian-Danish project Wind Atlas for Egypt, sponsored by<br />
the governments of Egypt and Denmark. The Danish contribution to the project and the publication of the<br />
atlas are funded by the Danish Ministry of Foreign Affairs through Danida.<br />
REFERENCES<br />
1. Mortensen, N.G., J.C. Hansen, J. Badger, B.H. Jørgensen, C.B. Hasager, L. Georgy Youssef, U.<br />
Said Said, A. Abd El-Salam Moussa, M. Akmal Mahmoud, A. El Sayed Yousef, A. Mahmoud<br />
Awad, M. Abd-El Raheem Ahmed, M. A.M. Sayed, M. Hussein Korany, M. Abd-El Baky Tarad<br />
(2005). Wind Atlas for Egypt, Measurements and Modelling 1991-2005. New and Renewable<br />
Energy Authority, Egyptian Meteorological Authority and Risø National Laboratory. ISBN 87-<br />
550-3493-4. 258 pp.<br />
2. Mortensen, N.G., D.N. Heathfield, L. Myllerup, L. Landberg and O. Rathmann (2005). Wind<br />
Atlas Analysis and Application Program: WAsP 8 Help Facility and On-line Documentation.<br />
Risø National Laboratory, Roskilde, Denmark. 335 topics. ISBN 87-550-3457-8.<br />
3. Niels G. Mortensen, Usama Said Said, Helmut P. Frank, Laila Georgy, Charlotte B. Hasager,<br />
Mohamad Akmal, J. Carsten Hansen and Ashour Abdel Salam (2003). Wind Atlas for the Gulf of<br />
Suez. Measurements and Modelling 1991-2001. New and Renewable Energy Authority, Cairo,<br />
and Risø National Laboratory, Roskilde. ISBN 87-550-3195-1. 196 pp.<br />
4. Helmut P. Frank (2003). Wind simulations for the Gulf of Suez with KAMM. Risø-I-1970(EN),<br />
Risø National Laboratory, Roskilde. 23 pp.<br />
5. Frank, H.P. and L. Landberg (1997a). Modelling the wind climate of Ireland. Boundary-Layer<br />
Meteorol. 85, 359-378.<br />
6. Frank, H.P. and L. Landberg (1997b). Numerical simulation of the Irish wind climate and comparison<br />
with wind atlas data, Proceedings of the European Wind Energy Conference, Dublin,<br />
Ireland, 6-9 October 1997, pp. 309-312.<br />
7. Frey-Buness, F., D. Heimann and R. Sausen, (1995). A statistical-dynamical downscaling procedure<br />
for global climate simulations, Theor. Appl. Climatol. 50, 117-131.<br />
8. Kalnay, E., M. Kanamitsu, R. Kistler, W. Collins, D. Deaven, L. Gandin, M. Iredell, S. Saha, G.<br />
White, J. Woollen, Y. Zhu, A. Leetmaa, R. Reynolds, M. Chelliah, W. Ebisuzaki, W. Higgins, J.<br />
Janowiak, K. C. Mo, C. Ropelewski, J. Wang, R. Jenne, and D. Joseph (1996). The<br />
NCEP/NCAR 40-year reanalysis project, Bull. Amer. Meteor. Soc. 77,437-471.<br />
9. Adrian, G. and F. Fiedler (1991). Simulation of unstationary wind and temperature fields over<br />
complex terrain and comparison with observations, Beitr. Phys. Atmosph. 64, 27-48.<br />
10. Adrian, G. (1994). Zur Dynamik des Windfeldes über orographisch gegliedertem Gelände, Ber.<br />
Deutschen Wetterdienstes 188, Offenbach am Main 1994. 142 pp.<br />
11. United States Geological Survey (USGS). GTOPO30 – Global Topographic Data.<br />
edcdaac.usgs.gov/gtopo30/gtopo30.asp<br />
12. United States Geological Survey (USGS). Global Land Cover Classification (GLCC).<br />
edcsns17.cr.usgs.gov/glcc/