Surface-Layer Wind and Turbulence profiling from LIDAR: Theory ...
Surface-Layer Wind and Turbulence profiling from LIDAR: Theory ...
Surface-Layer Wind and Turbulence profiling from LIDAR: Theory ...

Create successful ePaper yourself
Turn your PDF publications into a flip-book with our unique Google optimized e-Paper software.
<strong>Surface</strong><strong>Layer</strong> <strong>Wind</strong> <strong>and</strong> <strong>Turbulence</strong> Profiling <strong>from</strong> <strong>LIDAR</strong>:<br />
<strong>Theory</strong> <strong>and</strong> Measurements<br />
Régis DANIELIAN (Vestas <strong>Wind</strong> System)<br />
Hans Ejsing JØRGENSEN (<strong>Wind</strong> Energy Department, Risø. Contact: haej@risoe.dk)<br />
Torben MIKKELSEN (<strong>Wind</strong> Energy Department, Risø. Contact: tomi@risoe.dk)<br />
Jacob MANN (<strong>Wind</strong> Energy Department, Risø. Contact: jakob.mann@risoe.dk)<br />
Mike Harris (QinetiQ, contact: MHARRIS@qinetiq.com)<br />
Introduction<br />
As wind turbines become taller wind energy assessment <strong>and</strong><br />
also turbine control require knowledge of the detailed mean<br />
<strong>and</strong> turbulence wind profiles at bigger heights (150 meters <strong>and</strong><br />
more). A major challenge for wind power meteorology is<br />
therefore to circumvent the traditional role of the tall mettowers<br />
by replacing them with equally accurate, but groundbased<br />
remote sensing equipment.<br />
Compared to wind data <strong>from</strong> calibrated cup anemometers in<br />
tall mettowers, wind data <strong>from</strong> remotesensing<br />
instrumentation, such as SODARS <strong>and</strong> <strong>LIDAR</strong>S, still lack<br />
precision <strong>and</strong> data availability compared to mat data acquired<br />
<strong>from</strong> a met tower, in particular for use in connection with<br />
power curve reference <strong>and</strong> wind turbine certification purposes.<br />
However, recent progress with worldwide optical telecom<br />
technology <strong>and</strong> stable fibre lasers has led to realisation of a<br />
new <strong>and</strong> small wind Lidar system named ‘ZephIR 1 ’able to<br />
profile the surface layer up to ~200 meters height [2] <strong>and</strong> [3].<br />
In this paper we describe how improved signal processing has<br />
led to more accurate remote wind <strong>and</strong> turbulence profile<br />
measurements.<br />
The present study is based on a prototype of QinetiQ’s series<br />
produced ZephIR wind <strong>LIDAR</strong> system<br />
ZephIR consists of a CW (1.55m) wind <strong>LIDAR</strong> operating in<br />
the socalled LDA 2 mode: it performs conical scans of radial<br />
wind component at 30 degrees to zenith. By adjusting the<br />
Lidars focus, wind measurements can be obtained <strong>from</strong><br />
heights ranging <strong>from</strong> 10 to 200 meters above ground. The<br />
ZephIR prototype Lidar was designed to measure<br />
instantaneous radial wind speeds based on observed Doppler<br />
shifts at a rate of 25 Hz. By realtime processing of the<br />
Doppler shifts <strong>from</strong> three full revolutions of conical scanning<br />
(75 measurements), the horizontal wind speed <strong>and</strong> direction is<br />
given by the instrument every 3. second. By subsequent<br />
averaging of these 3sec measurements over a 10min period,<br />
the <strong>LIDAR</strong> provides an estimate of the mean horizontal speed<br />
<strong>and</strong> direction <strong>from</strong> each preset focal range.<br />
Included in this study, we have furthermore, for the first time<br />
to our knowledge, investigated a method to extract turbulence<br />
quantities such as the surface friction velocity u * [m/s] directly<br />
<strong>from</strong> the <strong>LIDAR</strong>s radial wind measurements.<br />
1 Produced by QinetiQ, Ltd; Malvern, U.K.<br />
2 Laser Doppler Anemometry<br />
Following a short description of the <strong>LIDAR</strong> <strong>and</strong> the applied<br />
data processing we compare the <strong>LIDAR</strong>retrieved mean wind<br />
<strong>and</strong> friction velocities with corresponding measurements<br />
<strong>from</strong> tall meteorological towers equipped with calibrated cup<br />
anemometers <strong>and</strong> 3D sonic anemometers at heights ranging<br />
between 44 meters <strong>and</strong> 123 meters.<br />
<strong>LIDAR</strong> theory<br />
Doppler shifted backscatter <strong>from</strong> the range where the<br />
coherent transmitted radiation is focussed is mixed with unshifted<br />
radiation on the detector; ant the resulting detector<br />
power is FFTanalysed for Doppler shift. A~1 MHz Doppler<br />
shift corresponds to approximately ~1 m/s radial wind speed<br />
of the aerosols in the focal volume. With the purpose to<br />
extract the horizontal wind component <strong>from</strong> the radial<br />
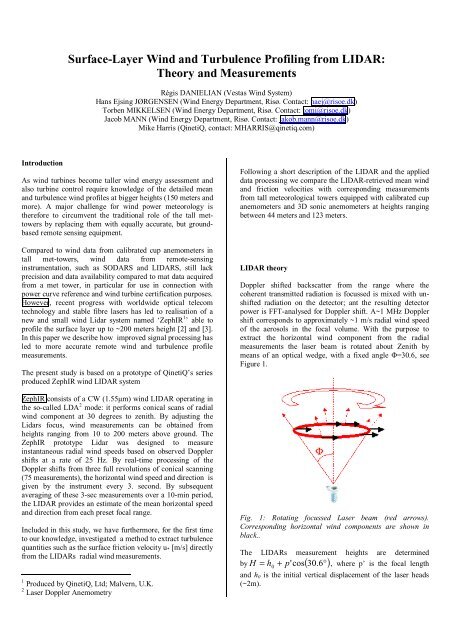
measurements the laser beam is rotated about Zenith by<br />
means of an optical wedge, with a fixed angle =30.6, see<br />
Figure 1.<br />
Fig. 1: Rotating focussed Laser beam (red arrows).<br />
Corresponding horizontal wind components are shown in<br />
black..<br />
The <strong>LIDAR</strong>s measurement heights are determined<br />
by H = h 0<br />
+ p'cos( 30. 6°<br />
), where p’is the focal length<br />
<strong>and</strong> h 0 is the initial vertical displacement of the laser heads<br />
(~2m).
Altitude [m]<br />
Length of the<br />
beam, p’[m]<br />
Diameter of<br />
scanning cone<br />
[m]<br />
40m 43.88m 44.77m<br />
60m 66.97m 68.18m<br />
80m 90.07m 91.70m<br />
100m 113.16m 115.21m<br />
200m 228.64m 232.77m<br />
against the direction of the wind, maximum Doppler shifts<br />
occur, see. Figure 3.<br />
Tabel 1: Geometrical characteristics of the conical scans<br />
The Doppler shift results <strong>from</strong> the difference of the wave<br />
vector k r e<br />
for the emission <strong>and</strong> k r r<br />
for the reflection. Let B r<br />
be the propagation vector of the transmitted Laser beam:<br />
Fig. 3:30minute of raw wind measurements obtained <strong>from</strong><br />
Doppler shifts as function of conical scan angle [0; 2π].<br />
In Fig. 3 the observed Doppler shifts have been transformed<br />
into velocities by the following equation:<br />
st ( , ) = ut ( )cos( − )sin( Φ ) + wt ( )cos( Φ)<br />
(3)<br />
θ θ θ<br />
d<br />
Fig. 2: Details of the interaction between the laser radiation<br />
<strong>and</strong> the horizontal component of the wind<br />
The mean wind direction is aligned along the xaxis:<br />
r µ ≡ u<br />
r ,<br />
r r<br />
v = w= 0<br />
r<br />
. To calculate the resulting Doppler shift, we<br />
define two frequencies, one representing the emission of the<br />
signal, <strong>and</strong> one representing its reception:<br />
r r ⎛ u<br />
⎞<br />
ω' e<br />
= ω<br />
0<br />
+ ke. µ ⇔ ν '<br />
e<br />
= ν ⎜1− cos( θ)sin( Φ)<br />
⎟<br />
⎝ c<br />
⎠<br />
(1)<br />
r r ⎛ u<br />
⎞<br />
ω' r<br />
= ω<br />
0<br />
+ kr. µ ⇔ ν '<br />
r<br />
= ν ⎜1+ cos( θ)sin( Φ)<br />
⎟<br />
⎝ c<br />
⎠<br />
where ν is the frequency [Hz]. The modulus of wave vector is<br />
r 2πν<br />
defined as k = . The Doppler shift of an elastic<br />
c<br />
scattered photon results as the difference between the outgoing<br />
<strong>and</strong> the backscattered radiation:<br />
u<br />
∆ ν = ν '<br />
r− ν '<br />
e<br />
= 2 ν cos( θ)sin( Φ ) (2)<br />
c<br />
This represents the Doppler shift detected by the Lidar. The<br />
quantity is the angle between the aerosol transported by the<br />
wind <strong>and</strong> the beam. When /2 or 3/2, the Doppler shift is<br />
zero. The ideal cases are =0 or ; but due to the conical<br />
scanning at fixed angle to vertical there will always be nonzero<br />
Doppler shifts wherever the wind comes <strong>from</strong>. The<br />
Doppler shift frequency signal that appears on the Lidar’s<br />
detector will give the following typical picture if we sample<br />
complete rotations. When the Laser beam is pointing into or<br />
<strong>and</strong> then shown as function of scan angle . A curve has been<br />
fitted through the data points. The fitted curve allows<br />
calculation of u, w <strong>and</strong> if the Lidar has been properly<br />
oriented (to the North) a curve fit also yields the direction d<br />
of the mean wind speed. In normal operation mode the<br />
horizontal wind vector is determined <strong>from</strong> 3 full conical<br />
rotations of 1second duration each. During each revolution a<br />
total of 25 Doppler spectra are obtained with the present<br />
instrument. An average wind speed <strong>from</strong> the conical scans is<br />
then obtained by a curve fit to 3 full rotations of such Doppler<br />
measurements <strong>and</strong> encompasses therefore up to 75 raw<br />
spectra as obtained over three revolutions of 2. u(t), w(t) <strong>and</strong><br />
d are consequently representing averages over 3 seconds in<br />
time.<br />
Geometry of the Gaussian beam:<br />
The radius <strong>and</strong> the focal width of the Laser beam changing as<br />
function of the measurement height <strong>and</strong> the effective<br />
measurement volume is consequently determined by the<br />
system optics. The laser beam is characterized by its Rayleigh<br />
length<br />
z<br />
R .<br />
2<br />
πW0<br />
z R<br />
= 50.6µ<br />
m<br />
λ<br />
At the output of the fibre this quantity is<br />
= , where W 0 is the radius of the<br />
beam in the optical fiber. This Rayleigh length represents the<br />
halfwidth where most of the power of the laser beam is<br />
gathered, according to the Lorentzian distribution of energy<br />
among the beam. By adjusting the fiber end near the focal<br />
point of the lens, the beam can be focused to take wind<br />
measurements at preset heights. The characteristics of the<br />
laser beam at the fiber end is via the lens projected to the<br />
external focal volume of length z (Rayleigh length) <strong>and</strong> of<br />
focal width W. At a distance p’<strong>from</strong> the lens the beams crosssection<br />
is given by 1 :<br />
R
2<br />
⎛<br />
2 2<br />
⎛ p'<br />
⎞ ⎞<br />
W ( p') = W<br />
0<br />
1<br />
⎜<br />
+⎜ ⎟<br />
z ⎟<br />
⎝ ⎝ R ⎠ ⎠<br />
The outgoing beam diameter of the ZephIR lidar is ~ 4 cm so<br />
that the maximum power density at the instrument is of order<br />
of ~ 2 10 2 [ Wcm 2 ]. The Laser beam is focused at the preset<br />
distance corresponding to the decided measurement height. In<br />
the following the position of the output of the external fibre<br />
before the lens is donoted p; <strong>and</strong> the position of the waist<br />
after the lens by p’. When the Laser beam is focused, the<br />
characteristic (radius <strong>and</strong> focal width) will change, as shown<br />
in Fig.4. The radius <strong>and</strong> the focal width, W out (p’) <strong>and</strong> 2Z’ R ,<br />
respectively evolve as function of measurement height.<br />
(4)<br />
radius increases linearly with distance while the focal width<br />
increases with distance squared.<br />
Wout [mm]<br />
6<br />
5<br />
4<br />
3<br />
2<br />
1<br />
0<br />
Wout(p')<br />
2 Z'r<br />
0 50 100 150 200 250<br />
H [m]<br />
140<br />
120<br />
100<br />
80<br />
60<br />
40<br />
20<br />
0<br />
2 Z'r [m]<br />
Fig. 6: Overview of the radius (W out , in blue) <strong>and</strong> the focal<br />
width (2Z’ R, in red) for different altitudes of scanning (H)<br />
Fig. 4: Beam propagation<br />
Fig.5 shows details at the waist position (focal point) for the<br />
focal width (2Z R ’), the radius W out (p’), <strong>and</strong> the angle of<br />
deflection of the Laser beam ’.<br />
Fig. 5: Details of the characteristics of the focalized Laser<br />
beam<br />
As p moves closer (within a fraction of a millimeter) to the<br />
focal point of the lens (F=20cm), the further away will the<br />
external Laser beam be focused (the waist location, p’) :<br />
The volume of the beam, <strong>from</strong> where plane coherent radiation<br />
backscatters, can to a first approximation be considered a<br />
doubletruncated cone (See figure 5). The radius of the beam<br />
is very small; the focus volume is always very small (0.153<br />
litre at 60m height, 1.174 litre at 100m height). As an<br />
approximation we will use only the quantity +/ Z’ R to<br />
express the length where the measure will be done. The<br />
radius of the beam (blue) increases linearly with the altitude,<br />
<strong>and</strong> is the order of the millimetres within our range of altitude<br />
of measurements (40m100m); but the focal width 2Z’ R (red<br />
curve) on the other h<strong>and</strong> grows quadratic about 1 orders of<br />
magnitude (<strong>from</strong> 4m at 40m until 32m at 100m). The focal<br />
width +/ “Z R ’represents the range where about 50% of the<br />
focussed radiation is gathered, <strong>and</strong> represents the range at<br />
which wind measurements will be taken.<br />
During an experiment at the test site Høvsøre in northwestern<br />
part of Denmark, the Lidar have been evaluate with<br />
respect to precision [2] <strong>and</strong> [3]. The Lidar data have been<br />
compared with calibrated Risø cup anemometers <strong>and</strong> Metek<br />
Sonics (Model USA1) all located on the met tower, the Lidar<br />
was installed 200m away <strong>from</strong> the tower, an example of the<br />
comparison are showen in figure 7 (Here measured at 80m<br />
height). This data set is obtained over a period of four days of<br />
measurements. The data have been filtered because of rainy<br />
days, or direction changes resulting in wake <strong>from</strong> the turbines<br />
at the test site <strong>and</strong> tower effects.<br />
H [m] p’[m] W out (p’) [mm] 2Z’ R [m]<br />
40m 43.88m 1mm 4.8m<br />
60m 66.97m 1.7mm 11m<br />
80m 90.07m 2mm 20.2m<br />
100m 113.42m 2.8mm 32.4m<br />
200m 228.64m 5.6mm 128.7m<br />
Tab. 2: Main data of the conical scan for different altitudes of<br />
scanning<br />
Figure 6 shows the characteristics of the external beam as<br />
function of measurement distance H. The focussed beams
Fig. 7: Regression of 10min averaged wind speeds <strong>from</strong> lidar<br />
<strong>and</strong> cup obtained on the31 st May 2004 at the Høvsøre test<br />
site, Denmark<br />
Fig. 8: Main view of interaction between the rotating Laser<br />
beam <strong>and</strong> the wind<br />
r r r<br />
If we let µ ( t)<br />
= u(<br />
t)<br />
+ w(<br />
t)<br />
, <strong>and</strong> denote the tilt angle of<br />
the wind, then can be positive or negative, <strong>and</strong> then also<br />
w(t) will be respectively positive <strong>and</strong> negative. At these two<br />
points, the interaction between the transmitted Laser beam,<br />
<strong>and</strong> the backscattered light <strong>and</strong> the aerosols can be described<br />
in the following way:<br />
The LidarCup comparison shows nearly the same quality as a<br />
Cup vs. Cup intercomparison <strong>from</strong> the same height. The<br />
separation between the Lidar <strong>and</strong> tower is in the order of 200<br />
meters. The good correlation is also described in [3].<br />
Remote measurement of the friction velocity<br />
Secondly, we have investigated a method of estimating the<br />
the surface friction velocity e.g. entering into the horizontal<br />
mean wind profile equation:<br />
u ⎛<br />
*<br />
z ⎞<br />
uz ( ) = ln ⎜ ⎟<br />
Eq.:7<br />
κ ⎝ z0<br />
⎠<br />
Here, is the von Karman constant equal to ~0.4; <strong>and</strong> z 0 is the<br />
roughness length of the surface.<br />
In the following we write the instantaneous velocities as<br />
u(t) <strong>and</strong> w(t) <strong>and</strong> split them into a perturbation <strong>and</strong> an a mean<br />
part i.e u(t)=+u’<strong>and</strong> w(t)=+w’, the friction velocity,<br />
u * , over a specified averaging time is the defined as:<br />
u* = − uw ' '<br />
Eq.:8<br />
The points named P 1 <strong>and</strong> P 5 ,(see figure 8) which are within the<br />
direction of the main stream of the wind, which means that the<br />
term d of the fitted curve s() is equal to 0 or .<br />
Fig. 9a: In P 1 Fig. 9b: In P 5<br />
In P 1 (Fig. 9a) we will get the following Doppler shift:<br />
ν<br />
∆ν<br />
1(<br />
t)<br />
= 2 ( u(<br />
t)sin(<br />
Φ)<br />
− w(<br />
t)cos(<br />
Φ)<br />
)<br />
c<br />
Eq.:9<br />
In P 5 (Fig. 9b) we will get the following Doppler shift:<br />
ν<br />
∆ν<br />
5(<br />
t)<br />
= −2<br />
( u(<br />
t)sin(<br />
Φ)<br />
+ w(<br />
t)cos(<br />
Φ)<br />
)<br />
c<br />
Eq.:9.1<br />
Detecting only the absolute value of these backscattered<br />
Doppler shifts we observe:<br />
ν<br />
∆ν<br />
1(<br />
t)<br />
= 2<br />
c<br />
ν<br />
∆ν<br />
5<br />
( t)<br />
= 2<br />
c<br />
( u(<br />
t)sin(<br />
Φ)<br />
− w(<br />
t)cos(<br />
Φ)<br />
)<br />
( u(<br />
t)sin(<br />
Φ)<br />
+ w(<br />
t)cos(<br />
Φ)<br />
)<br />
Eq.:10<br />
u(t) is always positive <strong>and</strong> w(t) can be either positive or<br />
negative depending on the tilt angle (respectively >0 or<br />
using the Reynolds decomposition of u(t)=+u’<br />
<strong>and</strong> w(t)=+w’. By subtracting the fitted curves at these
specific points, then squaring <strong>and</strong> averaging both of them,<br />
results in :<br />
=<br />
2<br />
1<br />
∆P<br />
⎛ c<br />
⎞<br />
⎜ ∆ν<br />
1(<br />
t).<br />
− < u > sin( Φ)<br />
+ < w > cos( Φ)<br />
⎟<br />
⎝ 2ν<br />
⎠<br />
=< u'<br />
2<br />
> sin( Φ)<br />
+ < w'<br />
− 2 < u'<br />
w'<br />
> cos( Φ)sin(<br />
Φ)<br />
= σ u<br />
sin( Φ)<br />
+ σ w<br />
cos( Φ)<br />
− 2 < u'<br />
w'<br />
> cos( Φ)sin(<br />
Φ)<br />
∆P<br />
2<br />
5<br />
2<br />
> cos( Φ)<br />
2<br />
Eq.:11<br />
=<br />
⎛ c<br />
⎞<br />
⎜ ∆ν<br />
5<br />
( t).<br />
− < u > sin( Φ)<br />
− < w > cos( Φ)<br />
⎟<br />
⎝ 2ν<br />
⎠<br />
=< u'<br />
2<br />
> sin( Φ)<br />
+ < w'<br />
+ 2 < u'<br />
w'<br />
> cos( Φ)sin(<br />
Φ)<br />
= σ u<br />
sin( Φ)<br />
+ σ w<br />
cos( Φ)<br />
+ 2 < u'<br />
w'<br />
> cos( Φ)sin(<br />
Φ)<br />
2<br />
> cos( Φ)<br />
2<br />
Eq.:11.1<br />
The sheer stress in the surface layer is known to be a<br />
negative term, then is bigger than . This<br />
explain why the points gathered in green (P 1 ) are more<br />
scattered than the corresponding part in blue (P 5 ). Due to this<br />
we are able to obtain information about the direction which<br />
solve the ambiguity regarding the 180 degree.<br />
In the two following graphics the curves of the backscattered<br />
signal is shown over a 10 minute period, here show as the<br />
complete rotations of the Laser beam (Fig.10a), P 1 (in green)<br />
<strong>and</strong> P 5 (in blue) is shown in (Fig.10b). These data have been<br />
taken the 31 st May 2004 at height of 80m in Høvsøre test site:<br />
Fig. 11: Regression line of u(t), over 10mn average, the31 st<br />
May 2004 in Høvsøre<br />
Although some values are biased (about 10 out of 144), the<br />
correlation is good, with a R 2 >0.8.<br />
The corresponding shear stress u *<br />
subtracting to :<br />
∆P<br />
2 2<br />
1 5<br />
( u)<br />
*<br />
− ∆P<br />
=< u > Φ +< w > Φ<br />
2 2<br />
' sin( ) ' cos( )<br />
− 2 < uw ' ' > cos( Φ)sin( Φ)<br />
−< u > Φ −< w > Φ<br />
2 2<br />
' sin( ) ' cos( )<br />
− 2 < uw ' ' > cos( Φ)sin( Φ)<br />
=−< uw ' ' > 4cos( Φ)sin( Φ)<br />
2<br />
= 4cos( Φ)sin( Φ)<br />
can ve calculated by<br />
Eq.:12<br />
The first test of comparison of u * (144 points of over 24 hours<br />
<strong>and</strong> 10mn average) gave the following results:<br />
Fig. 10a: Left: Raw <strong>LIDAR</strong> wind measurements s(t,) as<br />
function of azimuth angle (2) obtained over 10 minutes of<br />
sampling.<br />
Fig. 10b: Right: selection of P 1 (in green) <strong>and</strong> P 5 (in blue)<br />
The quality of the correlation between the data <strong>from</strong> the<br />
<strong>LIDAR</strong> <strong>and</strong> MET mast, the fitted regression line for 10min<br />
average comparison of u(t) between the Lidar <strong>and</strong> the cup<br />
anemometer on the 31 st May 2004 is shown in figure 11<br />
calculated :<br />
Fig. 12: u * , at 80m, 10mn average, the 31 st May 2004 at<br />
Høvsøre (Blue: sonic anemometer. Red: Lidar).
We notice on Fig.12 that for low values of u * the correlation is<br />
very good (u * 0.4) the measurements<br />
<strong>from</strong> the Lidar is biased, but the Lidar follows the dynamic<br />
evolution of u * . measured by the sonic anemomter The<br />
corresponding regression line over the 144 points is:<br />
Danielian, (2005) <strong>Wind</strong> lidar evaluation at the Danish wind<br />
test site in Høvsøre : To appear in Journal of windEngi.<br />
u * (Sonic)<br />
u * (Lidar)<br />
Fig. 13: Regression line of u * Lidar vs.sonic at 80m, 10min<br />
average, data measured on 31st May 2004 at Høvsøre<br />
In this paper we have shown that is possible to measure the<br />
friction velocity u * by a remote sensing equipment. This opens<br />
new perspectives for further research <strong>and</strong> investigation with<br />
regard to characterise entrainment turbulence <strong>and</strong> wind in<br />
wind farms by mounting the Lidar on the hub <strong>and</strong> measureing<br />
above the wind farm, Similar investigation of the flow over<br />
forests <strong>and</strong> cities with high roughness can be done where<br />
towers are difficult to erect.<br />
Acknowledges support <strong>from</strong> the EC "<strong>Wind</strong> Energy<br />
Assessment Studies <strong>and</strong> <strong>Wind</strong> Engineering" (WINDENG)<br />
Training Network (contract nr. . HPRNCT200200215) <strong>and</strong><br />
the Danish ENS project nr 1363/03.<br />
References<br />
[1]: ”Introduction to modern optics”, Grant R Fowles, Second<br />
Edition, p.:280<br />
[2]: Jørgensen et al. (2004) Site wind field determination<br />
using a CW Doppler lidar comparison with cup anemometers<br />
at Risø. In: Proceedings. Special topic conference: The<br />
science of making torque <strong>from</strong> wind, Delft (NL), 1921 Apr<br />
2004. (Delft University of Technology, Delft, 2004) p. 261<br />
266<br />
[3]: David A. Smith, Michael Harris, Adrian S. Coffey,<br />
Torben Mikkelsen, Hans E. Jørgensen, Jakob Mann, Régis