An Experimental and Theoretical £ Investigation of Annular Steam ...
An Experimental and Theoretical £ Investigation of Annular Steam ...
An Experimental and Theoretical £ Investigation of Annular Steam ...
Create successful ePaper yourself
Turn your PDF publications into a flip-book with our unique Google optimized e-Paper software.
- 22 -<br />
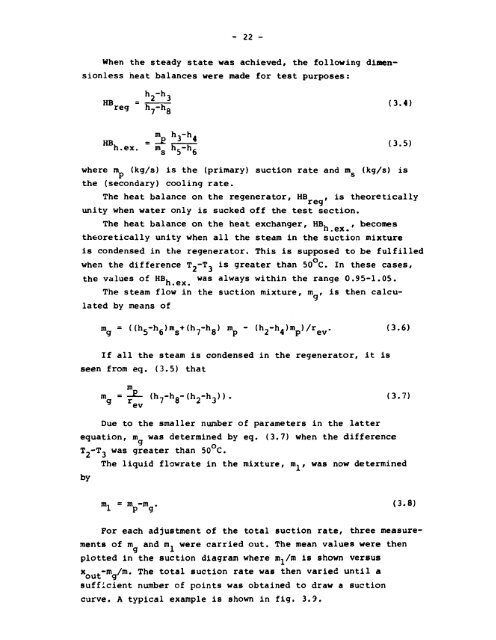
When the steady state was achieved, the following dimensionless<br />
heat balances were made for test purposes:<br />
reg<br />
h 2~ h 3<br />
n^-hg<br />
n.ex. m n c —h,<br />
s 5 6<br />
where m (kg/s) is the (primary) suction rate <strong>and</strong> m (kg/s) is<br />
P<br />
s<br />
lated by means <strong>of</strong><br />
the (secondary) cooling rate.<br />
The heat balance on the regenerator, HB , is theoretically<br />
unity when water only is sucked <strong>of</strong>f the test section.<br />
The heat balance on the heat exchanger, HB, , becomes<br />
theoretically unity when all the steam in the suction mixture<br />
is condensed in the regenerator. This is supposed to be fulfilled<br />
when the values the difference <strong>of</strong> HB. T - 2 was T, always is greater within than the 50 range C. In 0.95-1.05.<br />
these cases,<br />
The steam flow in the suction mixture, m , is then calcum<br />
g = ((h 5 -h 6 )m s +(h 7 -h 8 ) m p - (h 2 ~h 4 )m p )/r ev . (3.6)<br />
If all the steam is condensed in the regenerator, it is<br />
seen from eq. (3.5) that<br />
m<br />
m<br />
9<br />
= -£- (h 7 -h 8 -(h 2 -h 3 )).<br />
ev<br />
(3.7)<br />
Due to the smaller number <strong>of</strong> parameters in the latter<br />
equation, m was determined by eq. (3.7) when the difference<br />
T_-T 3 was greater than 50°C.<br />
The liquid flowrate in the mixture, m,, was now determined<br />
by<br />
m, = m -in . (3.8)<br />
1 p g<br />
For each adjustment <strong>of</strong> the total suction rate, three measurements<br />
<strong>of</strong> m <strong>and</strong> ra, were carried out. The mean values were then<br />
9 1<br />
plotted in the suction diagram where iru/m is shown versus<br />
x<br />
out<br />
.-m<br />
g<br />
/m. The total suction rate was then varied until a<br />
sufficient number <strong>of</strong> points was obtained to draw a suction<br />
curve. A typical example is shown in fig. 3.9.


