Representation of Ethnic Groups in Chemistry and Physics
Representation of Ethnic Groups in Chemistry and Physics
Representation of Ethnic Groups in Chemistry and Physics

You also want an ePaper? Increase the reach of your titles
YUMPU automatically turns print PDFs into web optimized ePapers that Google loves.
7: <strong>Ethnic</strong>ity <strong>and</strong> undergraduate studies<br />
7: <strong>Ethnic</strong>ity <strong>and</strong> undergraduate studies<br />
“The most underrepresented<br />
ethnic groups<br />
tend to do the<br />
least well <strong>in</strong> their<br />
undergraduate<br />
studies.”<br />
The <strong>in</strong>fluence <strong>of</strong> ethnicity on the choice <strong>of</strong> studies at undergraduate<br />
degree level is now considered. In particular, this<br />
section exam<strong>in</strong>es the <strong>in</strong>cl<strong>in</strong>ation towards study<strong>in</strong>g chemistry<br />
<strong>and</strong> physics at undergraduate level compared with<br />
alternative subjects that might compete <strong>in</strong> attract<strong>in</strong>g potential<br />
undergraduate scientists.<br />
7.1: <strong>Ethnic</strong>-m<strong>in</strong>ority representation <strong>in</strong><br />
undergraduate chemistry <strong>and</strong> physics<br />
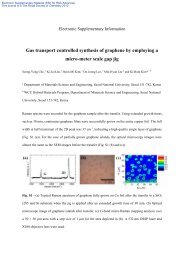
Utilis<strong>in</strong>g HESA 2002/2003 student data, the ethnic <strong>and</strong><br />
gender breakdown <strong>of</strong> the undergraduate population <strong>in</strong><br />
chemistry <strong>and</strong> physics, domiciled <strong>in</strong> Engl<strong>and</strong> <strong>and</strong> Wales<br />
<strong>and</strong> study<strong>in</strong>g for a first or enhanced first degree <strong>in</strong> chemistry<br />
<strong>and</strong> physics, is shown <strong>in</strong> figure 12. The charts show<br />
that both student bodies are ethnically white <strong>and</strong> male<br />
dom<strong>in</strong>ated. This is particularly the case <strong>in</strong> physics, where<br />
white males account for approximately three-quarters <strong>of</strong><br />
the population <strong>and</strong> ethnic-m<strong>in</strong>ority females account for less<br />
than 3% <strong>of</strong> all students. Although chemistry is male dom<strong>in</strong>ated,<br />
it is more ethnically diverse than physics <strong>and</strong> has a<br />
more balanced gender pr<strong>of</strong>ile.<br />
These charts do not, however, convey the extent to which<br />
ethnic groups are under- or over-represented relative to their<br />
numbers <strong>in</strong> the undergraduate population. HESA data are<br />
not a representative survey <strong>of</strong> activities <strong>in</strong> the population, as<br />
is the case with YCS data, but are <strong>in</strong>stead a census <strong>of</strong> students.<br />
Thus analysis is only possible <strong>of</strong> the ethnic structure<br />
with<strong>in</strong> the student body domiciled <strong>in</strong> Engl<strong>and</strong> <strong>and</strong> Wales. To<br />
normalise these data, the percentages for each subject ethnic-gender<br />
group are divided by the percentage <strong>of</strong> students<br />
<strong>in</strong> each <strong>of</strong> the respective ethnic-gender groups <strong>in</strong> the undergraduate<br />
student body as a whole, domiciled <strong>in</strong> Engl<strong>and</strong><br />
<strong>and</strong> Wales. The result<strong>in</strong>g figures have one taken away are<br />
then themselves expressed as percentages. The result<strong>in</strong>g<br />
figure yields the percentage under- or over-representation<br />
<strong>of</strong> each ethnic-gender group by subject area.<br />
This is now referred to as a measure <strong>of</strong> ethnic-gender representation<br />
(EGR), the formula for which is shown below.<br />
EGR =<br />
% ethnic-gender group <strong>in</strong> subject X<br />
100 ( –1)<br />
% ethnic-gender group <strong>in</strong> undergraduate population<br />
Us<strong>in</strong>g HESA student data for 2002/2003, evidence is<br />
found <strong>of</strong> pronounced ethnic differences <strong>in</strong> chemistry <strong>and</strong><br />
physics. Us<strong>in</strong>g a chi-squared significance test, it is shown<br />
that students are not r<strong>and</strong>omly allocated to physics <strong>and</strong><br />
chemistry by ethnic group. Figures 13 <strong>and</strong> 14 present the<br />
measures <strong>of</strong> EGR for chemistry <strong>and</strong> physics. The charts<br />
show that white males, but not white females, are over-represented<br />
<strong>in</strong> both chemistry <strong>and</strong> physics relative to their<br />
numbers <strong>in</strong> the undergraduate population. Among ethnicm<strong>in</strong>ority<br />
groups, ethnic Asian (Pakistani, Bangladeshi,<br />
Indian <strong>and</strong> Ch<strong>in</strong>ese) students, particularly Pakistani <strong>and</strong><br />
Bangladeshi students but also Indian <strong>and</strong> Ch<strong>in</strong>ese students,<br />
are over-represented <strong>in</strong> chemistry relative to their<br />
numbers <strong>in</strong> the undergraduate population. This contrasts<br />
with black students, <strong>and</strong> <strong>in</strong> particular black Caribbean students,<br />
who are notably under-represented. In physics, the<br />
under-representation <strong>of</strong> all ethnic-m<strong>in</strong>ority groups, with the<br />
exception <strong>of</strong> Ch<strong>in</strong>ese, is clear. Females are also under-represented<br />
generally.<br />
Lost potential<br />
The transfer <strong>in</strong>to undergraduate chemistry <strong>and</strong> physics<br />
courses relative to those identified as potential undergraduates<br />
is <strong>in</strong>terest<strong>in</strong>g (figures 1 <strong>and</strong> 2). For the most part,<br />
similar proportions <strong>of</strong> ethnic groups qualify<strong>in</strong>g as UCAS 12<br />
potential undergraduate chemists become undergraduate<br />
chemists. Interest<strong>in</strong>gly, 25% <strong>of</strong> black Caribbean potential<br />
undergraduate chemists become undergraduate chemists<br />
– almost twice the proportion for white students. However,<br />
overall, black Caribbean students are significantly less<br />
likely to read undergraduate chemistry than their white<br />
counterparts (figure 1).<br />
In contrast, overall, Indian <strong>and</strong> Ch<strong>in</strong>ese students are<br />
more likely to read undergraduate chemistry than white students:<br />
Indian students are twice as likely <strong>and</strong> Ch<strong>in</strong>ese students<br />
three times as likely. Interest<strong>in</strong>gly, overall, Pakistani<br />
students are one-<strong>and</strong>-a-half times as likely as white students<br />
to read undergraduate chemistry. Aga<strong>in</strong>, these observations<br />
are <strong>in</strong> l<strong>in</strong>e with the higher proportions <strong>of</strong> Indian <strong>and</strong><br />
Ch<strong>in</strong>ese students who are qualified to read chemistry.<br />
Comparison between potential undergraduate physicists<br />
<strong>and</strong> those read<strong>in</strong>g physics shows more variation <strong>in</strong> the proportions<br />
<strong>of</strong> students mov<strong>in</strong>g through. However, as the number<br />
<strong>of</strong> ethnic-m<strong>in</strong>ority students read<strong>in</strong>g undergraduate<br />
physics is small, more variation would be expected. Hav<strong>in</strong>g<br />
noted that, only Pakistani students are more likely than<br />
white students to transfer from be<strong>in</strong>g potential undergraduate<br />
physicists to become undergraduate physicists.<br />
However, overall, relative to the number <strong>of</strong> young people<br />
<strong>in</strong> the population, only Ch<strong>in</strong>ese students are more likely<br />
to read undergraduate physics than white students. In fact,<br />
Ch<strong>in</strong>ese students are twice as likely as white students to<br />
read undergraduate physics.<br />
Another comparison is with the students with three or<br />
more science A-levels. Given that significantly greater proportions<br />
<strong>of</strong> Indian <strong>and</strong> Ch<strong>in</strong>ese students than white students<br />
have three or more science A-levels, it is <strong>in</strong>terest<strong>in</strong>g to<br />
note that this does not result <strong>in</strong> similarly greater proportions<br />
<strong>of</strong> Indian <strong>and</strong> Ch<strong>in</strong>ese students read<strong>in</strong>g chemistry <strong>and</strong><br />
physics. However, as discussed later <strong>in</strong> this report, Asian<br />
students <strong>in</strong> particular favour medic<strong>in</strong>e-related subjects.<br />
20 R EPRESENTATION OF E THNIC G ROUPS IN C HEMISTRY AND P HYSICS M AY 2006