Representation of Ethnic Groups in Chemistry and Physics
Representation of Ethnic Groups in Chemistry and Physics
Representation of Ethnic Groups in Chemistry and Physics

Create successful ePaper yourself
Turn your PDF publications into a flip-book with our unique Google optimized e-Paper software.
Appendices<br />
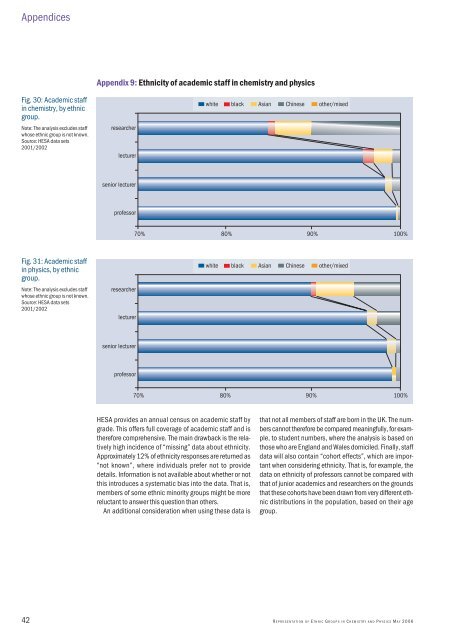
Appendix 9: <strong>Ethnic</strong>ity <strong>of</strong> academic staff <strong>in</strong> chemistry <strong>and</strong> physics<br />
Fig. 30: Academic staff<br />
<strong>in</strong> chemistry, by ethnic<br />
group.<br />
Note: The analysis excludes staff<br />
whose ethnic group is not known.<br />
Source: HESA data sets<br />
2001/2002<br />
researcher<br />
lecturer<br />
white black Asian Ch<strong>in</strong>ese other/mixed<br />
senior lecturer<br />
pr<strong>of</strong>essor<br />
70% 80% 90% 100%<br />
Fig. 31: Academic staff<br />
<strong>in</strong> physics, by ethnic<br />
group.<br />
Note: The analysis excludes staff<br />
whose ethnic group is not known.<br />
Source: HESA data sets<br />
2001/2002<br />
researcher<br />
lecturer<br />
white black Asian Ch<strong>in</strong>ese other/mixed<br />
senior lecturer<br />
pr<strong>of</strong>essor<br />
70% 80% 90% 100%<br />
HESA provides an annual census on academic staff by<br />
grade. This <strong>of</strong>fers full coverage <strong>of</strong> academic staff <strong>and</strong> is<br />
therefore comprehensive. The ma<strong>in</strong> drawback is the relatively<br />
high <strong>in</strong>cidence <strong>of</strong> “miss<strong>in</strong>g” data about ethnicity.<br />
Approximately 12% <strong>of</strong> ethnicity responses are returned as<br />
“not known”, where <strong>in</strong>dividuals prefer not to provide<br />
details. Information is not available about whether or not<br />
this <strong>in</strong>troduces a systematic bias <strong>in</strong>to the data. That is,<br />
members <strong>of</strong> some ethnic m<strong>in</strong>ority groups might be more<br />
reluctant to answer this question than others.<br />
An additional consideration when us<strong>in</strong>g these data is<br />
that not all members <strong>of</strong> staff are born <strong>in</strong> the UK. The numbers<br />
cannot therefore be compared mean<strong>in</strong>gfully, for example,<br />
to student numbers, where the analysis is based on<br />
those who are Engl<strong>and</strong> <strong>and</strong> Wales domiciled. F<strong>in</strong>ally, staff<br />
data will also conta<strong>in</strong> “cohort effects”, which are important<br />
when consider<strong>in</strong>g ethnicity. That is, for example, the<br />
data on ethnicity <strong>of</strong> pr<strong>of</strong>essors cannot be compared with<br />
that <strong>of</strong> junior academics <strong>and</strong> researchers on the grounds<br />
that these cohorts have been drawn from very different ethnic<br />
distributions <strong>in</strong> the population, based on their age<br />
group.<br />
42 R EPRESENTATION OF E THNIC G ROUPS IN C HEMISTRY AND P HYSICS M AY 2006