Representation of Ethnic Groups in Chemistry and Physics
Representation of Ethnic Groups in Chemistry and Physics
Representation of Ethnic Groups in Chemistry and Physics

You also want an ePaper? Increase the reach of your titles
YUMPU automatically turns print PDFs into web optimized ePapers that Google loves.
7: <strong>Ethnic</strong>ity <strong>and</strong> undergraduate studies<br />
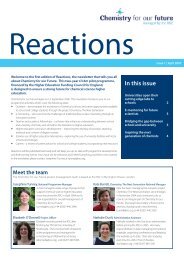
Fig. 20: EGR <strong>in</strong> law.<br />
Notes:<br />
1. Figures based on<br />
undergraduate students<br />
only.<br />
2. Engl<strong>and</strong>- <strong>and</strong> Walesdomiciled<br />
EGR is calculated<br />
with respect to the ethnicgender<br />
breakdown <strong>of</strong> the<br />
undergraduate population<br />
as a whole.<br />
Source: HESA student data set<br />
2002/2003<br />
Fig. 21: EGR <strong>in</strong> bus<strong>in</strong>ess<br />
<strong>and</strong> adm<strong>in</strong>istration.<br />
Notes:<br />
1. Figures based on<br />
undergraduate students<br />
only.<br />
2. Engl<strong>and</strong>- <strong>and</strong> Walesdomiciled<br />
EGR is calculated<br />
with respect to the ethnicgender<br />
breakdown <strong>of</strong> the<br />
undergraduate population<br />
as a whole.<br />
Source: HESA student data set<br />
2002/2003<br />
ethnic–gender representation<br />
ethnic–gender representation<br />
200<br />
180<br />
160<br />
140<br />
120<br />
100<br />
80<br />
60<br />
40<br />
20<br />
0<br />
–20<br />
–40<br />
–60<br />
120<br />
100<br />
80<br />
60<br />
40<br />
20<br />
0<br />
male female all<br />
white black Caribbean black African Indian Pakistani Bangladeshi Ch<strong>in</strong>ese<br />
male female all<br />
other/mixed<br />
–20<br />
–40<br />
white black Caribbean black African Indian Pakistani Bangladeshi Ch<strong>in</strong>ese<br />
other/mixed<br />
Fig. 19 (previous<br />
spread): EGR by<br />
medic<strong>in</strong>e <strong>and</strong> related<br />
subjects.<br />
Notes:<br />
1. Figures based on<br />
undergraduate students<br />
only.<br />
2. Engl<strong>and</strong>- <strong>and</strong> Walesdomiciled<br />
EGR is calculated<br />
with respect to the ethnicgender<br />
breakdown <strong>of</strong> the<br />
undergraduate population<br />
as a whole.<br />
Source: HESA student data set<br />
2002/2003<br />
are particularly prevalent <strong>in</strong> computer science. <strong>Ethnic</strong> Asian<br />
groups <strong>in</strong> particular are over-represented <strong>in</strong> this subject<br />
area, with Indian, Pakistani <strong>and</strong> Bangladeshi males almost<br />
three times as likely to study comput<strong>in</strong>g as would be<br />
expected based on the undergraduate population. There is<br />
a strong gender divide <strong>in</strong> these subjects, with males dom<strong>in</strong>at<strong>in</strong>g<br />
particularly <strong>in</strong> physical <strong>and</strong> mathematical sciences.<br />
Similarly, figure 20 presents the analysis <strong>of</strong> EGR <strong>in</strong> medic<strong>in</strong>e<br />
<strong>and</strong> other related subjects (i.e. dentistry, pharmacology<br />
<strong>and</strong> ophthalmics). These subjects are vocational<br />
alternatives to science at undergraduate level <strong>and</strong> thus<br />
compete with chemistry <strong>and</strong> physics for students. The<br />
results show a very strong ethnic Asian bias towards these<br />
subjects, irrespective <strong>of</strong> gender. A chi-squared significance<br />
test shows that students are not r<strong>and</strong>omly allocated to<br />
these subjects by ethnic group.<br />
A strong preference for study<strong>in</strong>g medic<strong>in</strong>e is particularly<br />
apparent for Indian students. They account for 27% <strong>of</strong> all<br />
dentistry students, 19% <strong>of</strong> all pharmacology students <strong>and</strong><br />
32% <strong>of</strong> all ophthalmics students. These figures are remarkably<br />
large compared with the numbers that might be<br />
expected based on the proportion <strong>of</strong> Indian students <strong>in</strong> the<br />
undergraduate body. Indian students are 5% <strong>of</strong> the undergraduate<br />
student body <strong>and</strong> only 2.3% <strong>of</strong> the population <strong>of</strong><br />
young people. At the same time, both white <strong>and</strong> black students<br />
are very much under-represented <strong>in</strong> all <strong>of</strong> these areas<br />
(with the exception <strong>of</strong> a relatively large number <strong>of</strong> black<br />
African students <strong>in</strong> pharmacology).<br />
Law <strong>and</strong> bus<strong>in</strong>ess<br />
It is <strong>in</strong>formative to analyse two other vocational subject<br />
areas outside SET <strong>and</strong> medic<strong>in</strong>e that may be attractive as<br />
26 R EPRESENTATION OF E THNIC G ROUPS IN C HEMISTRY AND P HYSICS M AY 2006