- Page 1 and 2: Annual Report
- Page 3 and 4: Contents OVERVIEW 2 Chief Executive
- Page 5 and 6: Governance and fi nancial managemen
- Page 7 and 8: In 2008-09, local communities were
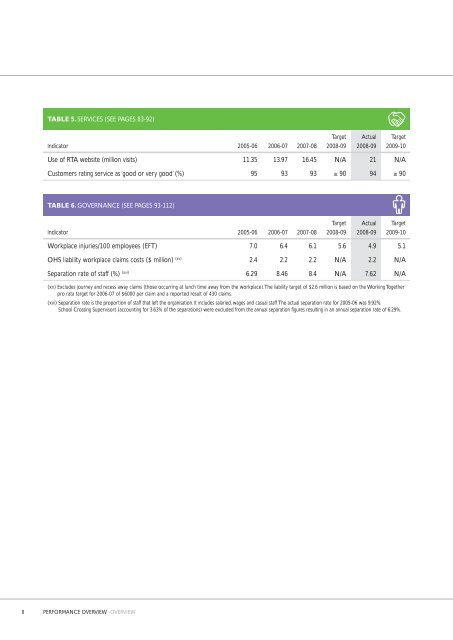
- Page 9: TABLE 3. SAFETY (SEE PAGES 47-64) I
- Page 13 and 14: Organisational chart The RTA is mad
- Page 15 and 16: Dr Soames Job | Director, Centre fo
- Page 17 and 18: Delivering better services Environm
- Page 19 and 20: REVIEW OF OPERATIONS Transport Deve
- Page 21 and 22: M5 Motorway widening A proposal was
- Page 23 and 24: Bonville Bypass The upgrade of this
- Page 25 and 26: Camden Valley Way In March 2009, th
- Page 27 and 28: Newell Highway Moree Town Centre By
- Page 29 and 30: Third Hunter River Crossing at Mait
- Page 31 and 32: Alternative transport Bus priority
- Page 33 and 34: Pedestrians The RTA implemented a n
- Page 35 and 36: Incidents and special events The RT
- Page 37 and 38: Traffi c and transport modelling Th
- Page 39 and 40: REVIEW OF OPERATIONS Asset Access 3
- Page 41 and 42: Trials of incremental pricing Incre
- Page 43 and 44: Other RTA assets associated with th
- Page 45 and 46: Pavement durability on the rural ro
- Page 47 and 48: Funding assistance to local council
- Page 49 and 50: REVIEW OF OPERATIONS Safety Fatalit
- Page 51 and 52: Factors in crashes Analysis of cras
- Page 53 and 54: Speed Zone Management System A Spee
- Page 55 and 56: Motor Cycle Graduated Licensing Sch
- Page 57 and 58: Drug driving Roadside Drug Testing
- Page 59 and 60: Regulation and enforcement Enhanced
- Page 61 and 62:
Point-to-point camera enforcement f
- Page 63 and 64:
Heavy vehicle roadworthiness survey
- Page 65 and 66:
Pedestrians and four-wheel drive ve
- Page 67 and 68:
REVIEW OF OPERATIONS Environment In
- Page 69 and 70:
During the year the RTA also comple
- Page 71 and 72:
Design of up-gradient stormwater di
- Page 73 and 74:
TABLE 7: BIODIVERSITY PROJECTS Acti
- Page 75 and 76:
Heritage Aboriginal culture and her
- Page 77 and 78:
CASE STUDY Old Peat’s Ferry Road,
- Page 79 and 80:
Other projects included: • The No
- Page 81 and 82:
CASE STUDY Improved environmental p
- Page 83 and 84:
Water management The RTA has prepar
- Page 85 and 86:
REVIEW OF OPERATIONS Services Custo
- Page 87 and 88:
RTA Contact Centre The RTA Contact
- Page 89 and 90:
NEVDIS The National Exchange of Veh
- Page 91 and 92:
e-Safety Check The RTA authorises a
- Page 93 and 94:
Review of regulatory approaches to
- Page 95 and 96:
REVIEW OF OPERATIONS Governance Org
- Page 97 and 98:
TABLE 9. EXECUTIVE COMMITTEES Commi
- Page 99 and 100:
Executive appointments and remunera
- Page 101 and 102:
Information Technology benchmarking
- Page 103 and 104:
Financial governance Financial stra
- Page 105 and 106:
Our people A safe and healthy workp
- Page 107 and 108:
Staff health, fi tness and well-bei
- Page 109 and 110:
Targeted recruitment programs The R
- Page 111 and 112:
Internal communication With about 7
- Page 113 and 114:
• RTA contractor Parsons Brincker
- Page 115 and 116:
Financial Statements
- Page 117 and 118:
Independent audit report (page 1) F
- Page 119 and 120:
Statement by the Chief Executive an
- Page 121 and 122:
Statement of recognised income and
- Page 123 and 124:
Cash fl ow statement for the year e
- Page 125 and 126:
Service group statements assets and
- Page 127 and 128:
Notes to and forming part of the Fi
- Page 129 and 130:
(e) Service groups AASB 1052 Disagg
- Page 131 and 132:
(k) Accounting for the Goods and Se
- Page 133 and 134:
(ii) Land and buildings Included in
- Page 135 and 136:
(vii) Leased assets A distinction i
- Page 137 and 138:
(iii) Derecognition of fi nancial l
- Page 139 and 140:
Infrastructure maintenance Major re
- Page 141 and 142:
(d) Other revenue Consolidated Pare
- Page 143 and 144:
7. Service groups of the agency (a)
- Page 145 and 146:
10. Non-current assets - property,
- Page 147 and 148:
(a) Land and buildings - consolidat
- Page 149 and 150:
(c) Infrastructure systems - consol
- Page 151 and 152:
M2 Motorway To facilitate the fi na
- Page 153 and 154:
(b) Other intangible assets - conso
- Page 155 and 156:
15. Financial instruments The RTA
- Page 157 and 158:
(b) Credit risk Credit risk arises
- Page 159 and 160:
The table summarises the maturity p
- Page 161 and 162:
The following information has been
- Page 163 and 164:
Reconciliation of the assets and li
- Page 165 and 166:
Historical information SASS Financi
- Page 167 and 168:
Economic assumptions The economic a
- Page 169 and 170:
Under the M4 lease agreement, $46.6
- Page 171 and 172:
20. Commitments for expenditure (a)
- Page 173 and 174:
Sydney Harbour Tunnel In June 1987
- Page 175 and 176:
26. Reconciliation of cash fl ows f
- Page 177 and 178:
Consolidated* Parent* Comparative R
- Page 179 and 180:
Consolidated Parent Reclassifi cati
- Page 181 and 182:
Independent audit Report (page 1) F
- Page 183 and 184:
Statement by the Chief Executive an
- Page 185 and 186:
Balance sheet as at 30 June 2009 No
- Page 187 and 188:
AASB & Interpretations AASB Standar
- Page 189 and 190:
2. Current assets (a) Receivables 3
- Page 191 and 192:
SASS Financial year to 30 June 2008
- Page 193 and 194:
Amount recognised in the statement
- Page 195 and 196:
SASS Financial year to 30 June 2006
- Page 197 and 198:
Nature of asset/liability If a surp
- Page 199 and 200:
Appendices
- Page 201 and 202:
Appendix 1. Major works Project Des
- Page 203 and 204:
Project Description Location Status
- Page 205 and 206:
Project Description Location Status
- Page 207 and 208:
Measures Action taken to implement
- Page 209 and 210:
Measures Action taken to implement
- Page 211 and 212:
Transport Certifi cation Australia
- Page 213 and 214:
Road Freight Advisory Council The R
- Page 215 and 216:
• Appointment of additional distr
- Page 217 and 218:
• Led the RTA’s involvement wit
- Page 219 and 220:
• Ongoing deployment of the Publi
- Page 221 and 222:
• Continued to participate in the
- Page 223 and 224:
• Identifi cation of four critica
- Page 225 and 226:
• Oversaw and facilitated the pre
- Page 227 and 228:
Appendix 5. Industrial relations Aw
- Page 229 and 230:
2008-09 actions to increase the emp
- Page 231 and 232:
Appendix 7. Ethnic Affairs Prioriti
- Page 233 and 234:
Appendix 9. Overseas travel by RTA
- Page 235 and 236:
Appendix 10. Freedom of Information
- Page 237 and 238:
In the fi fth case, on 22 December
- Page 239 and 240:
FOI 2008-09 Statistics SECTION A: N
- Page 241 and 242:
SECTION G: EXEMPT DOCUMENTS Number
- Page 243 and 244:
SECTION K: NOTATION OF PERSONAL REC
- Page 245 and 246:
SECTION R: RESULTS OF INTERNAL REVI
- Page 247 and 248:
Appendix 12. Consumer response TABL
- Page 249 and 250:
Road Transport (Driver Licensing) A
- Page 251 and 252:
Road Transport (General) Amendment
- Page 253 and 254:
Appendix 14. Land disposal The RTA
- Page 255 and 256:
Heavy vehicles • A truck driver
- Page 257 and 258:
• Sheahan Bridge duplication, Hum
- Page 259 and 260:
Upgrading the Pacifi c Highway •
- Page 261 and 262:
• Safe school travel. Tips for pa
- Page 263 and 264:
Appendix 17. Reporting of RTA contr
- Page 265 and 266:
Appendix 20. Privacy Management Rep
- Page 267 and 268:
Privacy Review P/2008/14 On 30 Sept
- Page 269 and 270:
Privacy Review P/2009/14 On 4 May 2
- Page 271 and 272:
Bridges • Performance review and
- Page 273 and 274:
TABLE 24. NSW LICENSED DRIVERS AND
- Page 275 and 276:
FIGURE 20. WORKERS COMPENSATION PRE
- Page 277 and 278:
Index
- Page 279 and 280:
H Heavy vehicles 11, 20, 25, 38-40,
- Page 281 and 282:
Contact details General inquiries 1
- Page 283:
Roads and Traffic Authority For fur