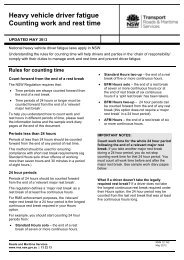
Balance sheet as at 30 June <strong>2009</strong> Consolidated Parent Notes Budget <strong>2009</strong> $’000 Actual <strong>2009</strong> $’000 Actual 2008 $’000 Actual <strong>2009</strong> $’000 Actual 2008 $’000 ASSETS Current Assets Cash and cash equivalents 8 206,219 186,179 179,958 186,179 179,958 Receivables 9(a) 129,655 147,560 129,655 147,560 129,655 Inventories 10,245 10,715 10,245 10,715 10,245 346,119 344,454 319,858 344,454 319,858 Non-current assets held for sale 12 71,122 40,893 71,122 40,893 71,122 Total Current Assets 417,241 385,347 390,980 385,347 390,980 Non-Current Assets Other fi nancial assets 9(b) 106,527 108,529 98,402 108,529 98,402 Property, Plant and Equipment – Land and Buildings 10(a) 2,939,852 2,996,887 2,890,778 2,996,887 2,890,778 – Plant and Equipment 10(b) 147,779 161,478 140,279 161,478 140,279 – Infrastructure Systems 10(c) 79,000,347 85,723,210 77,726,966 85,723,210 77,726,966 Total property, plant and equipment 82,087,978 88,881,575 80,758,023 88,881,575 80,758,023 Intangible assets 11(b) 16,160 30,788 19,599 30,788 19,599 Private Sector Provided Infrastructure 11(a) 580,266 539,105 448,419 539,105 448,419 Total Non-Current Assets 82,790,931 89,559,997 81,324,443 89,559,997 81,324,443 Total Assets 83,208,172 89,945,344 81,715,423 89,945,344 81,715,423 LIABILITIES Current Liabilities Payables 13 551,601 609,710 551,601 1,386,704 955,840 Borrowings 14 141,401 140,548 141,306 140,548 141,306 Provisions 16 219,213 237,469 213,493 - - Other 17 139,139 144,273 138,008 139,224 134,968 Total Current Liabilities 1,051,354 1,132,000 1,044,408 1,666,476 1,232,114 Non-Current Liabilities Borrowings 14 1,229,488 1,246,492 1,311,218 1,246,492 1,311,218 Provisions 16 187,693 534,476 187,706 - - Other 17 333,924 357,793 366,730 357,793 366,730 Total Non-Current Liabilities 1,751,105 2,138,761 1,865,654 1,604,285 1,677,948 Total Liabilities 2,802,459 3,270,761 2,910,062 3,270,761 2,910,062 Net Assets 80,405,713 86,674,583 78,805,361 86,674,583 78,805,361 EQUITY Reserves 18 35,025,304 41,837,842 35,053,304 41,837,842 35,053,304 Accumulated Funds 18 45,380,409 44,836,741 43,752,057 44,836,741 43,752,057 Total Equity 80,405,713 86,674,583 78,805,361 86,674,583 78,805,361 The accompanying notes form part of these fi nancial statements. 120 FINANCIAL STATEMENTS
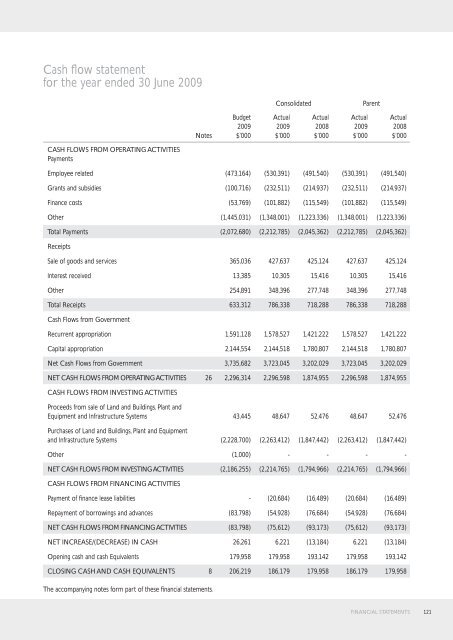
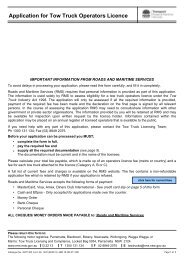
Cash fl ow statement for the year ended 30 June <strong>2009</strong> Consolidated Parent Notes Budget <strong>2009</strong> $’000 Actual <strong>2009</strong> $’000 Actual 2008 $’000 Actual <strong>2009</strong> $’000 Actual 2008 $’000 CASH FLOWS FROM OPERATING ACTIVITIES Payments Employee related (473,164) (530,391) (491,540) (530,391) (491,540) Grants and subsidies (100,716) (232,511) (214,937) (232,511) (214,937) Finance costs (53,769) (101,882) (115,549) (101,882) (115,549) Other (1,445,031) (1,348,001) (1,223,336) (1,348,001) (1,223,336) Total Payments (2,072,680) (2,212,785) (2,045,362) (2,212,785) (2,045,362) Receipts Sale of goods and services 365,036 427,637 425,124 427,637 425,124 Interest received 13,385 10,305 15,416 10,305 15,416 Other 254,891 348,396 277,748 348,396 277,748 Total Receipts 633,312 786,338 718,288 786,338 718,288 Cash Flows from <strong>Government</strong> Recurrent appropriation 1,591,128 1,578,527 1,421,222 1,578,527 1,421,222 Capital appropriation 2,144,554 2,144,518 1,780,807 2,144,518 1,780,807 Net Cash Flows from <strong>Government</strong> 3,735,682 3,723,045 3,202,029 3,723,045 3,202,029 NET CASH FLOWS FROM OPERATING ACTIVITIES 26 2,296,314 2,296,598 1,874,955 2,296,598 1,874,955 CASH FLOWS FROM INVESTING ACTIVITIES Proceeds from sale of Land and Buildings, Plant and Equipment and Infrastructure Systems 43,445 48,647 52,476 48,647 52,476 Purchases of Land and Buildings, Plant and Equipment and Infrastructure Systems (2,228,700) (2,263,412) (1,847,442) (2,263,412) (1,847,442) Other (1,000) - - - - NET CASH FLOWS FROM INVESTING ACTIVITIES (2,186,255) (2,214,765) (1,794,966) (2,214,765) (1,794,966) CASH FLOWS FROM FINANCING ACTIVITIES Payment of fi nance lease liabilities - (20,684) (16,489) (20,684) (16,489) Repayment of borrowings and advances (83,798) (54,928) (76,684) (54,928) (76,684) NET CASH FLOWS FROM FINANCING ACTIVITIES (83,798) (75,612) (93,173) (75,612) (93,173) NET INCREASE/(DECREASE) IN CASH 26,261 6,221 (13,184) 6,221 (13,184) Opening cash and cash Equivalents 179,958 179,958 193,142 179,958 193,142 CLOSING CASH AND CASH EQUIVALENTS 8 206,219 186,179 179,958 186,179 179,958 The accompanying notes form part of these fi nancial statements. FINANCIAL STATEMENTS 121
- Page 1 and 2:
Annual Report
- Page 3 and 4:
Contents OVERVIEW 2 Chief Executive
- Page 5 and 6:
Governance and fi nancial managemen
- Page 7 and 8:
In 2008-09, local communities were
- Page 9 and 10:
TABLE 3. SAFETY (SEE PAGES 47-64) I
- Page 11 and 12:
Financial overview Underpinning RTA
- Page 13 and 14:
Organisational chart The RTA is mad
- Page 15 and 16:
Dr Soames Job | Director, Centre fo
- Page 17 and 18:
Delivering better services Environm
- Page 19 and 20:
REVIEW OF OPERATIONS Transport Deve
- Page 21 and 22:
M5 Motorway widening A proposal was
- Page 23 and 24:
Bonville Bypass The upgrade of this
- Page 25 and 26:
Camden Valley Way In March 2009, th
- Page 27 and 28:
Newell Highway Moree Town Centre By
- Page 29 and 30:
Third Hunter River Crossing at Mait
- Page 31 and 32:
Alternative transport Bus priority
- Page 33 and 34:
Pedestrians The RTA implemented a n
- Page 35 and 36:
Incidents and special events The RT
- Page 37 and 38:
Traffi c and transport modelling Th
- Page 39 and 40:
REVIEW OF OPERATIONS Asset Access 3
- Page 41 and 42:
Trials of incremental pricing Incre
- Page 43 and 44:
Other RTA assets associated with th
- Page 45 and 46:
Pavement durability on the rural ro
- Page 47 and 48:
Funding assistance to local council
- Page 49 and 50:
REVIEW OF OPERATIONS Safety Fatalit
- Page 51 and 52:
Factors in crashes Analysis of cras
- Page 53 and 54:
Speed Zone Management System A Spee
- Page 55 and 56:
Motor Cycle Graduated Licensing Sch
- Page 57 and 58:
Drug driving Roadside Drug Testing
- Page 59 and 60:
Regulation and enforcement Enhanced
- Page 61 and 62:
Point-to-point camera enforcement f
- Page 63 and 64:
Heavy vehicle roadworthiness survey
- Page 65 and 66:
Pedestrians and four-wheel drive ve
- Page 67 and 68:
REVIEW OF OPERATIONS Environment In
- Page 69 and 70:
During the year the RTA also comple
- Page 71 and 72: Design of up-gradient stormwater di
- Page 73 and 74: TABLE 7: BIODIVERSITY PROJECTS Acti
- Page 75 and 76: Heritage Aboriginal culture and her
- Page 77 and 78: CASE STUDY Old Peat’s Ferry Road,
- Page 79 and 80: Other projects included: • The No
- Page 81 and 82: CASE STUDY Improved environmental p
- Page 83 and 84: Water management The RTA has prepar
- Page 85 and 86: REVIEW OF OPERATIONS Services Custo
- Page 87 and 88: RTA Contact Centre The RTA Contact
- Page 89 and 90: NEVDIS The National Exchange of Veh
- Page 91 and 92: e-Safety Check The RTA authorises a
- Page 93 and 94: Review of regulatory approaches to
- Page 95 and 96: REVIEW OF OPERATIONS Governance Org
- Page 97 and 98: TABLE 9. EXECUTIVE COMMITTEES Commi
- Page 99 and 100: Executive appointments and remunera
- Page 101 and 102: Information Technology benchmarking
- Page 103 and 104: Financial governance Financial stra
- Page 105 and 106: Our people A safe and healthy workp
- Page 107 and 108: Staff health, fi tness and well-bei
- Page 109 and 110: Targeted recruitment programs The R
- Page 111 and 112: Internal communication With about 7
- Page 113 and 114: • RTA contractor Parsons Brincker
- Page 115 and 116: Financial Statements
- Page 117 and 118: Independent audit report (page 1) F
- Page 119 and 120: Statement by the Chief Executive an
- Page 121: Statement of recognised income and
- Page 125 and 126: Service group statements assets and
- Page 127 and 128: Notes to and forming part of the Fi
- Page 129 and 130: (e) Service groups AASB 1052 Disagg
- Page 131 and 132: (k) Accounting for the Goods and Se
- Page 133 and 134: (ii) Land and buildings Included in
- Page 135 and 136: (vii) Leased assets A distinction i
- Page 137 and 138: (iii) Derecognition of fi nancial l
- Page 139 and 140: Infrastructure maintenance Major re
- Page 141 and 142: (d) Other revenue Consolidated Pare
- Page 143 and 144: 7. Service groups of the agency (a)
- Page 145 and 146: 10. Non-current assets - property,
- Page 147 and 148: (a) Land and buildings - consolidat
- Page 149 and 150: (c) Infrastructure systems - consol
- Page 151 and 152: M2 Motorway To facilitate the fi na
- Page 153 and 154: (b) Other intangible assets - conso
- Page 155 and 156: 15. Financial instruments The RTA
- Page 157 and 158: (b) Credit risk Credit risk arises
- Page 159 and 160: The table summarises the maturity p
- Page 161 and 162: The following information has been
- Page 163 and 164: Reconciliation of the assets and li
- Page 165 and 166: Historical information SASS Financi
- Page 167 and 168: Economic assumptions The economic a
- Page 169 and 170: Under the M4 lease agreement, $46.6
- Page 171 and 172: 20. Commitments for expenditure (a)
- Page 173 and 174:
Sydney Harbour Tunnel In June 1987
- Page 175 and 176:
26. Reconciliation of cash fl ows f
- Page 177 and 178:
Consolidated* Parent* Comparative R
- Page 179 and 180:
Consolidated Parent Reclassifi cati
- Page 181 and 182:
Independent audit Report (page 1) F
- Page 183 and 184:
Statement by the Chief Executive an
- Page 185 and 186:
Balance sheet as at 30 June 2009 No
- Page 187 and 188:
AASB & Interpretations AASB Standar
- Page 189 and 190:
2. Current assets (a) Receivables 3
- Page 191 and 192:
SASS Financial year to 30 June 2008
- Page 193 and 194:
Amount recognised in the statement
- Page 195 and 196:
SASS Financial year to 30 June 2006
- Page 197 and 198:
Nature of asset/liability If a surp
- Page 199 and 200:
Appendices
- Page 201 and 202:
Appendix 1. Major works Project Des
- Page 203 and 204:
Project Description Location Status
- Page 205 and 206:
Project Description Location Status
- Page 207 and 208:
Measures Action taken to implement
- Page 209 and 210:
Measures Action taken to implement
- Page 211 and 212:
Transport Certifi cation Australia
- Page 213 and 214:
Road Freight Advisory Council The R
- Page 215 and 216:
• Appointment of additional distr
- Page 217 and 218:
• Led the RTA’s involvement wit
- Page 219 and 220:
• Ongoing deployment of the Publi
- Page 221 and 222:
• Continued to participate in the
- Page 223 and 224:
• Identifi cation of four critica
- Page 225 and 226:
• Oversaw and facilitated the pre
- Page 227 and 228:
Appendix 5. Industrial relations Aw
- Page 229 and 230:
2008-09 actions to increase the emp
- Page 231 and 232:
Appendix 7. Ethnic Affairs Prioriti
- Page 233 and 234:
Appendix 9. Overseas travel by RTA
- Page 235 and 236:
Appendix 10. Freedom of Information
- Page 237 and 238:
In the fi fth case, on 22 December
- Page 239 and 240:
FOI 2008-09 Statistics SECTION A: N
- Page 241 and 242:
SECTION G: EXEMPT DOCUMENTS Number
- Page 243 and 244:
SECTION K: NOTATION OF PERSONAL REC
- Page 245 and 246:
SECTION R: RESULTS OF INTERNAL REVI
- Page 247 and 248:
Appendix 12. Consumer response TABL
- Page 249 and 250:
Road Transport (Driver Licensing) A
- Page 251 and 252:
Road Transport (General) Amendment
- Page 253 and 254:
Appendix 14. Land disposal The RTA
- Page 255 and 256:
Heavy vehicles • A truck driver
- Page 257 and 258:
• Sheahan Bridge duplication, Hum
- Page 259 and 260:
Upgrading the Pacifi c Highway •
- Page 261 and 262:
• Safe school travel. Tips for pa
- Page 263 and 264:
Appendix 17. Reporting of RTA contr
- Page 265 and 266:
Appendix 20. Privacy Management Rep
- Page 267 and 268:
Privacy Review P/2008/14 On 30 Sept
- Page 269 and 270:
Privacy Review P/2009/14 On 4 May 2
- Page 271 and 272:
Bridges • Performance review and
- Page 273 and 274:
TABLE 24. NSW LICENSED DRIVERS AND
- Page 275 and 276:
FIGURE 20. WORKERS COMPENSATION PRE
- Page 277 and 278:
Index
- Page 279 and 280:
H Heavy vehicles 11, 20, 25, 38-40,
- Page 281 and 282:
Contact details General inquiries 1
- Page 283:
Roads and Traffic Authority For fur