Carbon & Water Footprint of Oranges and Strawberries - SAI Platform
Carbon & Water Footprint of Oranges and Strawberries - SAI Platform
Carbon & Water Footprint of Oranges and Strawberries - SAI Platform

Create successful ePaper yourself
Turn your PDF publications into a flip-book with our unique Google optimized e-Paper software.
Federal Department <strong>of</strong> Economic Affairs FDEA<br />
Agroscope Reckenholz-Tänikon Research Station AR T<br />
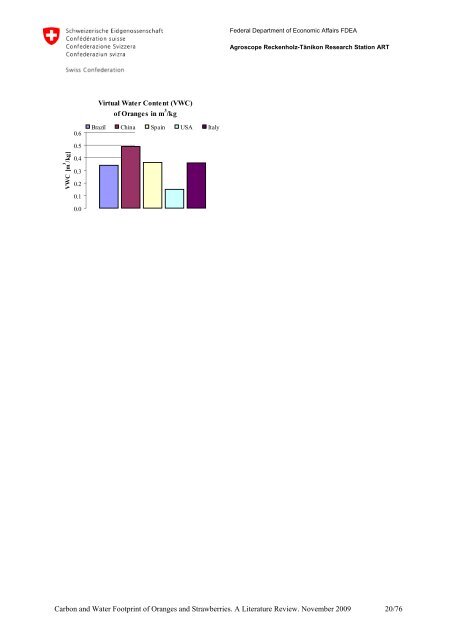
Virtual <strong>Water</strong> Content (VWC)<br />
<strong>of</strong> <strong>Oranges</strong> in m 3 /kg<br />
Virtual <strong>Water</strong> Content (VWC)<br />
<strong>of</strong> <strong>Oranges</strong> in m 3 /ha<br />
VWC [m 3 /kg]<br />
0.6<br />
0.5<br />
0.4<br />
0.3<br />
0.2<br />
0.1<br />
0.0<br />
Brazil China Spain USA Italy<br />
VWC [m 3 /ha]<br />
8'000<br />
7'000<br />
6'000<br />
5'000<br />
4'000<br />
3'000<br />
2'000<br />
1'000<br />
0<br />
Brazil China Spain USA Italy<br />
Figure 2: Virtual water content <strong>of</strong> oranges in m 3 /kg<br />
for selected countries. Source: Chapagain &<br />
Hoekstra (2004a; 2004b).<br />
Figure 3: Virtual water content <strong>of</strong> oranges in m 3 /ha<br />
for selected countries. Source: Chapagain &<br />
Hoekstra (2004a; 2004b). (Converted data, see<br />
section 2.4).<br />
Table 3: Yield <strong>and</strong> virtual water content (VWC) <strong>of</strong> oranges for selected<br />
countries. Source: Chapagain & Hoekstra (2004a; 2004b). The data in<br />
italics have been converted (see section 2.4).<br />
Country<br />
Yield<br />
[kg/ha]<br />
VWC<br />
[m 3 /kg]<br />
VWC<br />
[m 3 /ha]<br />
Brazil 22'329 0.342 7'637<br />
China 10'251 0.490 5'023<br />
Spain 19'653 0.362 7'114<br />
USA 33'326 0.149 4'966<br />
Italy 16'006 0.359 5'746<br />
<strong>Carbon</strong> <strong>and</strong> <strong>Water</strong> <strong>Footprint</strong> <strong>of</strong> <strong>Oranges</strong> <strong>and</strong> <strong>Strawberries</strong>. A Literature Review. November 2009 20/76