Carbon & Water Footprint of Oranges and Strawberries - SAI Platform
Carbon & Water Footprint of Oranges and Strawberries - SAI Platform
Carbon & Water Footprint of Oranges and Strawberries - SAI Platform

You also want an ePaper? Increase the reach of your titles
YUMPU automatically turns print PDFs into web optimized ePapers that Google loves.
Federal Department <strong>of</strong> Economic Affairs FDEA<br />
Agroscope Reckenholz-Tänikon Research Station AR T<br />
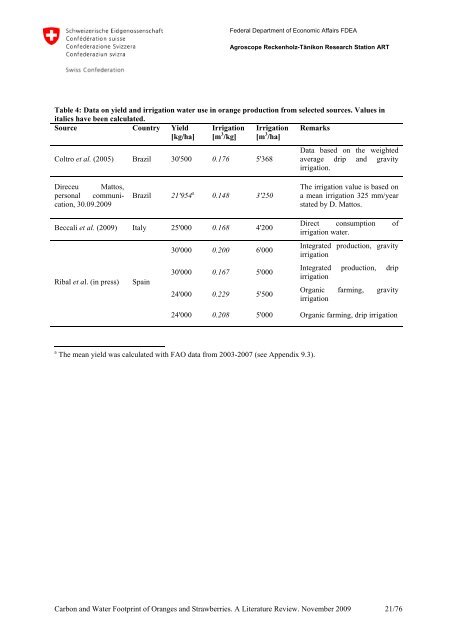
Table 4: Data on yield <strong>and</strong> irrigation water use in orange production from selected sources. Values in<br />
italics have been calculated.<br />
Source Country Yield<br />
[kg/ha]<br />
Irrigation<br />
[m 3 /kg]<br />
Irrigation<br />
[m 3 /ha]<br />
Remarks<br />
Coltro et al. (2005) Brazil 30'500 0.176 5'368<br />
Data based on the weighted<br />
average drip <strong>and</strong> gravity<br />
irrigation.<br />
Direceu Mattos,<br />
personal communication,<br />
30.09.2009<br />
Brazil 21'954 a 0.148 3'250<br />
The irrigation value is based on<br />
a mean irrigation 325 mm/year<br />
stated by D. Mattos.<br />
Beccali et al. (2009) Italy 25'000 0.168 4'200<br />
30'000 0.200 6'000<br />
30'000 0.167 5'000<br />
Ribal et al. (in press) Spain<br />
24'000 0.229 5'500<br />
Direct consumption <strong>of</strong><br />
irrigation water.<br />
Integrated production, gravity<br />
irrigation<br />
Integrated production, drip<br />
irrigation<br />
Organic farming, gravity<br />
irrigation<br />
24'000 0.208 5'000 Organic farming, drip irrigation<br />
a The mean yield was calculated with FAO data from 2003-2007 (see Appendix 9.3).<br />
<strong>Carbon</strong> <strong>and</strong> <strong>Water</strong> <strong>Footprint</strong> <strong>of</strong> <strong>Oranges</strong> <strong>and</strong> <strong>Strawberries</strong>. A Literature Review. November 2009 21/76