Carbon & Water Footprint of Oranges and Strawberries - SAI Platform
Carbon & Water Footprint of Oranges and Strawberries - SAI Platform
Carbon & Water Footprint of Oranges and Strawberries - SAI Platform

You also want an ePaper? Increase the reach of your titles
YUMPU automatically turns print PDFs into web optimized ePapers that Google loves.
Federal Department <strong>of</strong> Economic Affairs FDEA<br />
Agroscope Reckenholz-Tänikon Research Station ART<br />
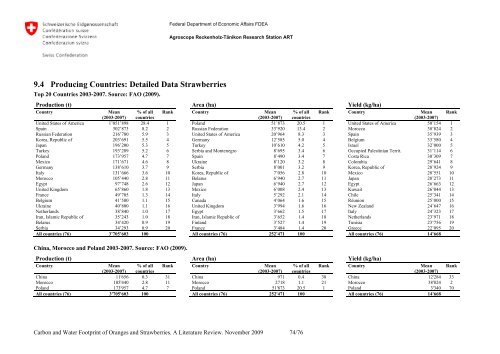
9.4 Producing Countries: Detailed Data <strong>Strawberries</strong><br />
Top 20 Countries 2003-2007. Source: FAO (2009).<br />
Production (t) Area (ha) Yield (kg/ha)<br />
Country<br />
Mean % <strong>of</strong> all Rank Country Mean % <strong>of</strong> all Rank Country Mean Rank<br />
(2003-2007) countries<br />
(2003-2007) countries<br />
(2003-2007)<br />
United States <strong>of</strong> America 1’051’898 28.4 1 Pol<strong>and</strong> 51’873 20.5 1 United States <strong>of</strong> America 50’154 1<br />
Spain 302’873 8.2 2 Russian Federation 33’920 13.4 2 Morocco 38’824 2<br />
Russian Federation 216’780 5.9 3 United States <strong>of</strong> America 20’964 8.3 3 Spain 35’939 3<br />
Korea, Republic <strong>of</strong> 203’691 5.5 4 Germany 12’585 5.0 4 Belgium 33’580 4<br />
Japan 196’200 5.3 5 Turkey 10’610 4.2 5 Israel 32’000 5<br />
Turkey 193’289 5.2 6 Serbia <strong>and</strong> Montenegro 8’695 3.4 6 Occupied Palestinian Territ. 31’114 6<br />
Pol<strong>and</strong> 173’957 4.7 7 Spain 8’490 3.4 7 Costa Rica 30’309 7<br />
Mexico 171’671 4.6 8 Ukraine 8’120 3.2 8 Colombia 29’641 8<br />
Germany 138’610 3.7 9 Serbia 8’001 3.2 9 Korea, Republic <strong>of</strong> 28’924 9<br />
Italy 131’666 3.6 10 Korea, Republic <strong>of</strong> 7’056 2.8 10 Mexico 28’551 10<br />
Morocco 105’440 2.8 11 Belarus 6’940 2.7 11 Japan 28’273 11<br />
Egypt 97’748 2.6 12 Japan 6’940 2.7 12 Egypt 26’663 12<br />
United Kingdom 65’860 1.8 13 Mexico 6’008 2.4 13 Kuwait 26’044 13<br />
France 49’705 1.3 14 Italy 5’292 2.1 14 Chile 25’341 14<br />
Belgium 41’500 1.1 15 Canada 4’064 1.6 15 Réunion 25’000 15<br />
Ukraine 40’800 1.1 16 United Kingdom 3’994 1.6 16 New Zeal<strong>and</strong> 24’647 16<br />
Netherl<strong>and</strong>s 38’840 1.0 17 Egypt 3’662 1.5 17 Italy 24’323 17<br />
Iran, Islamic Republic <strong>of</strong> 35’243 1.0 18 Iran, Islamic Republic <strong>of</strong> 3’652 1.4 18 Netherl<strong>and</strong>s 23’971 18<br />
Belarus 34’420 0.9 19 Finl<strong>and</strong> 3’527 1.4 19 Tunisia 23’756 19<br />
Serbia 34’293 0.9 20 France 3’484 1.4 20 Greece 22’095 20<br />
All countries (76) 3’705’603 100 All countries (76) 252’471 100 All countries (76) 14’668<br />
China, Morocco <strong>and</strong> Pol<strong>and</strong> 2003-2007. Source: FAO (2009).<br />
Production (t) Area (ha) Yield (kg/ha)<br />
Country<br />
Mean % <strong>of</strong> all Rank Country Mean % <strong>of</strong> all Rank Country Mean Rank<br />
(2003-2007) countries<br />
(2003-2007) countries<br />
(2003-2007)<br />
China 11'656 0.3 31 China 971 0.4 38 China 12'284 33<br />
Morocco 105'440 2.8 11 Morocco 2718 1.1 21 Morocco 38'824 2<br />
Pol<strong>and</strong> 173'957 4.7 7 Pol<strong>and</strong> 51'873 20.5 1 Pol<strong>and</strong> 3'340 70<br />
All countries (76) 3'705'603 100 All countries (76) 252'471 100 All countries (76) 14'668<br />
<strong>Carbon</strong> <strong>and</strong> <strong>Water</strong> <strong>Footprint</strong> <strong>of</strong> <strong>Oranges</strong> <strong>and</strong> <strong>Strawberries</strong>. A Literature Review. November 2009 74/76