Carbon & Water Footprint of Oranges and Strawberries - SAI Platform
Carbon & Water Footprint of Oranges and Strawberries - SAI Platform
Carbon & Water Footprint of Oranges and Strawberries - SAI Platform

Create successful ePaper yourself
Turn your PDF publications into a flip-book with our unique Google optimized e-Paper software.
Federal Department <strong>of</strong> Economic Affairs FDEA<br />
Agroscope Reckenholz-Tänikon Research Station AR T<br />
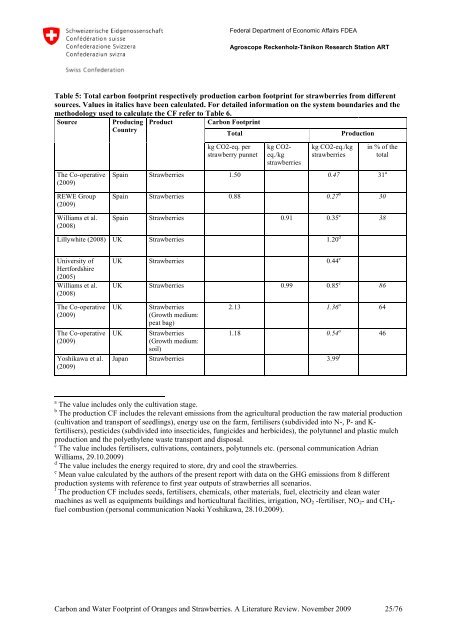
Table 5: Total carbon footprint respectively production carbon footprint for strawberries from different<br />
sources. Values in italics have been calculated. For detailed information on the system boundaries <strong>and</strong> the<br />
methodology used to calculate the CF refer to Table 6.<br />
Source<br />
Producing Product<br />
<strong>Carbon</strong> <strong>Footprint</strong><br />
Country<br />
Total<br />
Production<br />
The Co-operative<br />
(2009)<br />
REWE Group<br />
(2009)<br />
Williams et al.<br />
(2008)<br />
kg CO2-eq. per<br />
strawberry punnet<br />
kg CO2-<br />
eq./kg<br />
strawberries<br />
kg CO2-eq./kg<br />
strawberries<br />
in % <strong>of</strong> the<br />
total<br />
Spain <strong>Strawberries</strong> 1.50 0.47 31 a<br />
Spain <strong>Strawberries</strong> 0.88 0.27 b 30<br />
Spain <strong>Strawberries</strong> 0.91 0.35 c 38<br />
Lillywhite (2008) UK <strong>Strawberries</strong> 1.20 d<br />
University <strong>of</strong><br />
Hertfordshire<br />
(2005)<br />
Williams et al.<br />
(2008)<br />
The Co-operative<br />
(2009)<br />
The Co-operative<br />
(2009)<br />
Yoshikawa et al.<br />
(2009)<br />
UK <strong>Strawberries</strong> 0.44 e<br />
UK <strong>Strawberries</strong> 0.99 0.85 c 86<br />
UK<br />
<strong>Strawberries</strong><br />
(Growth medium:<br />
peat bag)<br />
2.13 1.36 a 64<br />
UK <strong>Strawberries</strong><br />
(Growth medium:<br />
soil)<br />
1.18 0.54 a 46<br />
Japan <strong>Strawberries</strong> 3.99 f<br />
a The value includes only the cultivation stage.<br />
b The production CF includes the relevant emissions from the agricultural production the raw material production<br />
(cultivation <strong>and</strong> transport <strong>of</strong> seedlings), energy use on the farm, fertilisers (subdivided into N-, P- <strong>and</strong> K-<br />
fertilisers), pesticides (subdivided into insecticides, fungicides <strong>and</strong> herbicides), the polytunnel <strong>and</strong> plastic mulch<br />
production <strong>and</strong> the polyethylene waste transport <strong>and</strong> disposal.<br />
c The value includes fertilisers, cultivations, containers, polytunnels etc. (personal communication Adrian<br />
Williams, 29.10.2009)<br />
d The value includes the energy required to store, dry <strong>and</strong> cool the strawberries.<br />
e Mean value calculated by the authors <strong>of</strong> the present report with data on the GHG emissions from 8 different<br />
production systems with reference to first year outputs <strong>of</strong> strawberries all scenarios.<br />
f The production CF includes seeds, fertilisers, chemicals, other materials, fuel, electricity <strong>and</strong> clean water<br />
machines as well as equipments buildings <strong>and</strong> horticultural facilities, irrigation, NO 2 -fertiliser, NO 2 - <strong>and</strong> CH 4 -<br />
fuel combustion (personal communication Naoki Yoshikawa, 28.10.2009).<br />
<strong>Carbon</strong> <strong>and</strong> <strong>Water</strong> <strong>Footprint</strong> <strong>of</strong> <strong>Oranges</strong> <strong>and</strong> <strong>Strawberries</strong>. A Literature Review. November 2009 25/76