Scania annual report 2001
Scania annual report 2001
Scania annual report 2001

Create successful ePaper yourself
Turn your PDF publications into a flip-book with our unique Google optimized e-Paper software.
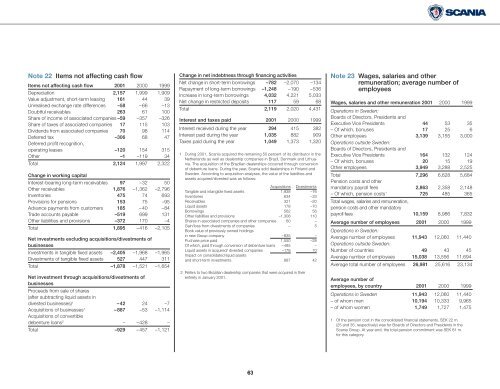
Note 22 Items not affecting cash flow<br />
Items not affecting cash flow <strong>2001</strong> 2000 1999<br />
Depreciation 2,157 1,999 1,909<br />
Value adjustment, short-term leasing 161 44 39<br />
Unrealised exchange rate differences –58 –66 –13<br />
Doubtful receivables 263 61 100<br />
Share of income of associated companies –59 –357 –326<br />
Share of taxes of associated companies 17 115 103<br />
Dividends from associated companies 70 98 114<br />
Deferred tax –306 68 47<br />
Deferred profit recognition,<br />
operating leases –120 154 315<br />
Other –1 –119 34<br />
Total 2,124 1,997 2,322<br />
Change in working capital<br />
Interest-bearing long-term receivables 97 –32 50<br />
Other receivables 1,876 –1,362 –2,796<br />
Inventories 475 74 693<br />
Provisions for pensions 153 75 –95<br />
Advance payments from customers 185 –40 –84<br />
Trade accounts payable –519 699 131<br />
Other liabilities and provisions –372 170 –4<br />
Total 1,895 –416 –2,105<br />
Net investments excluding acquisitions/divestments of<br />
businesses<br />
Investments in tangible fixed assets –2,405 –1,968 –1,965<br />
Divestments of tangible fixed assets 527 447 311<br />
Total –1,878 –1,521 –1,654<br />
Net investment through acquisitions/divestments of<br />
businesses<br />
Proceeds from sale of shares<br />
(after subtracting liquid assets in<br />
divested businesses) 1 –42 24 –7<br />
Acquisitions of businesses 1 –887 –53 –1,114<br />
Acquisitions of convertible<br />
debenture loans 2 – –428 –<br />
Total –929 –457 –1,121<br />
Change in net indebtness through financing activities<br />
Net change in short-term borrowings –782 –2,070 –134<br />
Repayment of long-term borrowings –1,248 –190 –536<br />
Increase in long-term borrowings 4,032 4,221 5,033<br />
Net change in restricted deposits 117 59 68<br />
Total 2,119 2,020 4,431<br />
Interest and taxes paid <strong>2001</strong> 2000 1999<br />
Interest received during the year 294 415 382<br />
Interest paid during the year 1,035 882 909<br />
Taxes paid during the year 1,049 1,373 1,320<br />
1 During <strong>2001</strong>, <strong>Scania</strong> acquired the remaining 50 percent of its distributor in the<br />
Netherlands as well as dealership companies in Brazil, Denmark and Lithuania.<br />
The acquisition of the Brazilian dealerships occurred through conversion<br />
of debenture loans. During the year, <strong>Scania</strong> sold dealerships in Finland and<br />
Sweden. According to acquisition analyses, the value of the liabilities and<br />
assets acquired/divested was as follows:<br />
Acquisitions Divestments<br />
Tangible and intangible fixed assets 1,938 –76<br />
Inventories 634 –33<br />
Receivables 321 –20<br />
Liquid assets 178 –70<br />
Borrowings 562 56<br />
Other liabilities and provisions –1,308 110<br />
Shares in associated companies and other companies 60 –<br />
Gain/loss from divestments of companies – 5<br />
Book value of previously owned holdings<br />
in new Group company –835 –<br />
Puchase price paid 1,550 –28<br />
Of which, paid through conversion of debenture loans –485 –<br />
Liquid assets in acquired/ divested companies –178 70<br />
Impact on consolidated liquid assets<br />
and short-term investments 887 42<br />
2 Refers to two Brazilian dealership companies that were acquired in their<br />
entirety in January <strong>2001</strong>.<br />
Note 23 Wages, salaries and other<br />
remuneration; average number of<br />
employees<br />
Wages, salaries and other remuneration <strong>2001</strong> 2000 1999<br />
Operations in Sweden:<br />
Boards of Directors, Presidents and<br />
Executive Vice Presidents 44 53 35<br />
– Of which, bonuses 17 25 6<br />
Other employees 3,139 3,155 3,000<br />
Operations outside Sweden:<br />
Boards of Directors, Presidents and<br />
Executive Vice Presidents 164 132 124<br />
– Of which, bonuses 20 15 19<br />
Other employees 3,949 3,288 2,525<br />
Total 7,296 6,628 5,684<br />
Pension costs and other<br />
mandatory payroll fees 2,863 2,358 2,148<br />
– Of which, pension costs 1 725 485 365<br />
Total wages, salaries and remuneration,<br />
pension costs and other mandatory<br />
payroll fees 10,159 8,986 7,832<br />
Average number of employees <strong>2001</strong> 2000 1999<br />
Operations in Sweden:<br />
Average number of employees 11,943 12,060 11,440<br />
Operations outside Sweden:<br />
Number of countries 49 43 45<br />
Average number of employees 15,038 13,556 11,694<br />
Average total number of employees 26,981 25,616 23,134<br />
Average number of<br />
employees, by country <strong>2001</strong> 2000 1999<br />
Operations in Sweden 11,943 12,060 11,440<br />
– of whom men 10,194 10,333 9,965<br />
– of whom women 1,749 1,727 1,475<br />
1 Of the pension cost in the consolidated financial statements, SEK 22 m.<br />
(25 and 35, respectively) was for Boards of Directors and Presidents in the<br />
<strong>Scania</strong> Group. At year-end, the total pension commitment was SEK 81 m.<br />
for this category.<br />
63