Section 1: Academic Achievement - National Center for School ...
Section 1: Academic Achievement - National Center for School ...
Section 1: Academic Achievement - National Center for School ...

You also want an ePaper? Increase the reach of your titles
YUMPU automatically turns print PDFs into web optimized ePapers that Google loves.
They have determined that by the end of 1 st grade and on up through other grades, the most<br />
accurate indicator of reading success is oral reading fluency (how many words per minute a<br />
student can read.) The University of Oregon has set minimum benchmark levels <strong>for</strong> each<br />
grade level. Essentially this means that in order to be a successful reader the students need to<br />
be able to read a certain number of words per minute. Students who do not reach the<br />
benchmark are then labeled “at risk.” These “at risk” students are then targeted <strong>for</strong> additional<br />
reading instruction to help raise their fluency and increase their success as readers. The lower<br />
the number of students “at risk” in the school, the more effective the instruction is according<br />
to Reading First. This is a required assessment <strong>for</strong> the Reading First grant we were<br />
participating in and it is data we used at the building level on a regular basis. The 2005-2006<br />
was the 2 nd year we had used this assessment. I looked at building level numbers first so I<br />
could compare my students to the building results, then I separated out my H&HM students.<br />
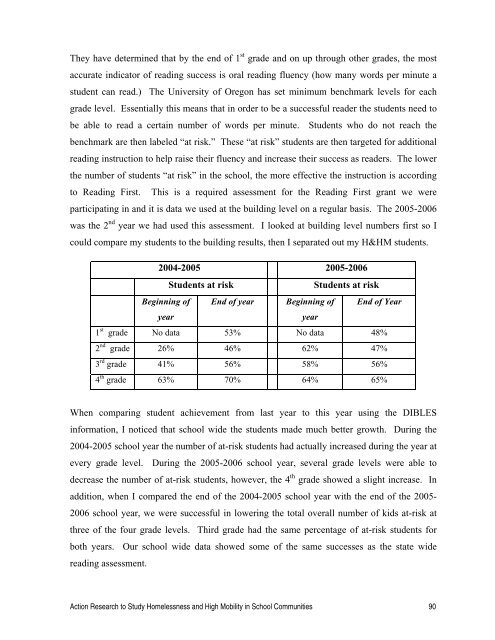
2004-2005 2005-2006<br />
Students at risk<br />
Students at risk<br />
Beginning of End of year Beginning of End of Year<br />
year<br />
year<br />
1 st grade No data 53% No data 48%<br />
2 nd grade 26% 46% 62% 47%<br />
3 rd grade 41% 56% 58% 56%<br />
4 th grade 63% 70% 64% 65%<br />
When comparing student achievement from last year to this year using the DIBLES<br />
in<strong>for</strong>mation, I noticed that school wide the students made much better growth. During the<br />
2004-2005 school year the number of at-risk students had actually increased during the year at<br />
every grade level. During the 2005-2006 school year, several grade levels were able to<br />
decrease the number of at-risk students, however, the 4 th grade showed a slight increase. In<br />
addition, when I compared the end of the 2004-2005 school year with the end of the 2005-<br />
2006 school year, we were successful in lowering the total overall number of kids at-risk at<br />
three of the four grade levels. Third grade had the same percentage of at-risk students <strong>for</strong><br />
both years. Our school wide data showed some of the same successes as the state wide<br />
reading assessment.<br />
Action Research to Study Homelessness and High Mobility in <strong>School</strong> Communities 90