travel demand forecasting report - Sonoma County Transportation ...
travel demand forecasting report - Sonoma County Transportation ...
travel demand forecasting report - Sonoma County Transportation ...

You also want an ePaper? Increase the reach of your titles
YUMPU automatically turns print PDFs into web optimized ePapers that Google loves.
Appendix I: Travel Demand Forecasting Report<br />
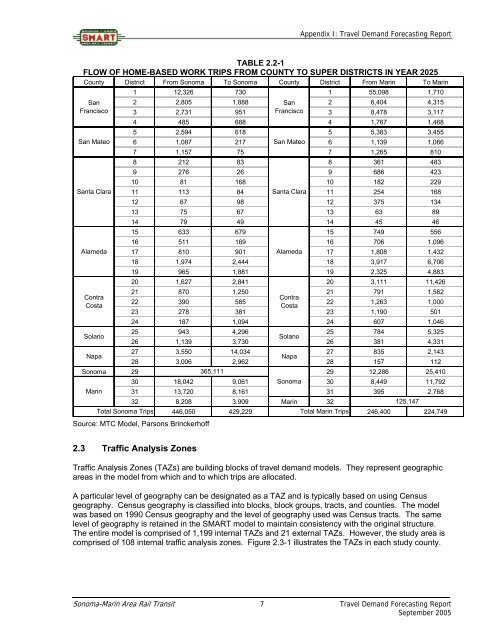
TABLE 2.2-1<br />
FLOW OF HOME-BASED WORK TRIPS FROM COUNTY TO SUPER DISTRICTS IN YEAR 2025<br />
<strong>County</strong> District From <strong>Sonoma</strong> To <strong>Sonoma</strong> <strong>County</strong> District From Marin To Marin<br />
1 12,326 730 1 55,098 1,710<br />
San<br />
2 2,805 1,888 San<br />
2 6,404 4,315<br />
Francisco 3 2,731 951 Francisco 3 8,478 3,117<br />
4 485 688 4 1,767 1,468<br />
5 2,594 618 5 5,383 3,455<br />
San Mateo 6 1,087 217 San Mateo 6 1,139 1,066<br />
7 1,157 75 7 1,265 810<br />
8 212 83 8 361 483<br />
9 276 26 9 686 423<br />
10 81 168 10 182 229<br />
Santa Clara 11 113 84 Santa Clara 11 254 168<br />
12 67 98 12 375 134<br />
13 75 67 13 63 89<br />
14 79 49 14 45 46<br />
15 633 679 15 749 556<br />
16 511 169 16 706 1,096<br />
Alameda 17 810 901 Alameda 17 1,808 1,432<br />
18 1,974 2,444 18 3,917 6,706<br />
19 965 1,881 19 2,325 4,883<br />
20 1,627 2,841 20 3,111 11,426<br />
21 870 1,250 21 791 1,562<br />
Contra<br />
Contra<br />
22 390 585 22 1,263 1,000<br />
Costa<br />
Costa<br />
23 278 381 23 1,190 501<br />
24 187 1,094 24 607 1,046<br />
Solano<br />
Napa<br />
25 943 4,296 25 784 5,325<br />
Solano<br />
26 1,139 3,730 26 381 4,331<br />
27 3,550 14,034 27 835 2,143<br />
Napa<br />
28 3,006 2,962 28 157 112<br />
<strong>Sonoma</strong> 29 365,111<br />
29 12,286 25,410<br />
30 18,042 9,061 <strong>Sonoma</strong> 30 8,449 11,792<br />
Marin 31 13,720 8,161 31 395 2,768<br />
32 8,208 3,909 Marin 32<br />
125,147<br />
Total <strong>Sonoma</strong> Trips 446,050 429,229 Total Marin Trips 246,400 224,749<br />
Source: MTC Model, Parsons Brinckerhoff<br />
2.3 Traffic Analysis Zones<br />
Traffic Analysis Zones (TAZs) are building blocks of <strong>travel</strong> <strong>demand</strong> models. They represent geographic<br />
areas in the model from which and to which trips are allocated.<br />
A particular level of geography can be designated as a TAZ and is typically based on using Census<br />
geography. Census geography is classified into blocks, block groups, tracts, and counties. The model<br />
was based on 1990 Census geography and the level of geography used was Census tracts. The same<br />
level of geography is retained in the SMART model to maintain consistency with the original structure.<br />
The entire model is comprised of 1,199 internal TAZs and 21 external TAZs. However, the study area is<br />
comprised of 108 internal traffic analysis zones. Figure 2.3-1 illustrates the TAZs in each study county.<br />
<strong>Sonoma</strong>-Marin Area Rail Transit 7 Travel Demand Forecasting Report<br />
September 2005