travel demand forecasting report - Sonoma County Transportation ...
travel demand forecasting report - Sonoma County Transportation ...
travel demand forecasting report - Sonoma County Transportation ...

You also want an ePaper? Increase the reach of your titles
YUMPU automatically turns print PDFs into web optimized ePapers that Google loves.
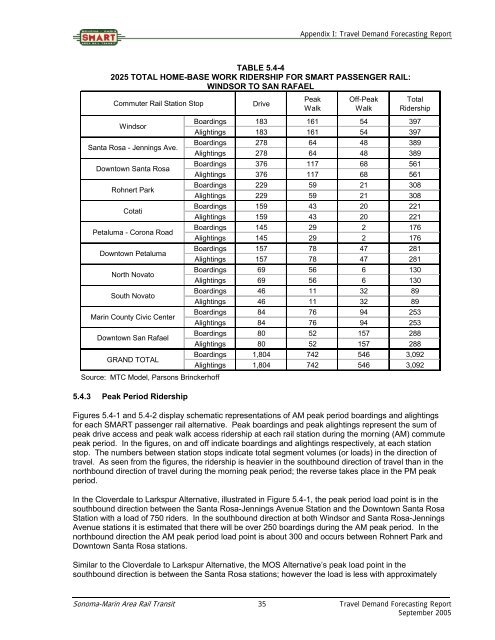
Appendix I: Travel Demand Forecasting Report<br />
TABLE 5.4-4<br />
2025 TOTAL HOME-BASE WORK RIDERSHIP FOR SMART PASSENGER RAIL:<br />
WINDSOR TO SAN RAFAEL<br />
Commuter Rail Station Stop<br />
Drive<br />
Peak<br />
Walk<br />
Off-Peak<br />
Walk<br />
Total<br />
Ridership<br />
Boardings 183 161 54 397<br />
Windsor<br />
Alightings 183 161 54 397<br />
Boardings 278 64 48 389<br />
Santa Rosa - Jennings Ave.<br />
Alightings 278 64 48 389<br />
Boardings 376 117 68 561<br />
Downtown Santa Rosa<br />
Alightings 376 117 68 561<br />
Boardings 229 59 21 308<br />
Rohnert Park<br />
Alightings 229 59 21 308<br />
Boardings 159 43 20 221<br />
Cotati<br />
Alightings 159 43 20 221<br />
Boardings 145 29 2 176<br />
Petaluma - Corona Road<br />
Alightings 145 29 2 176<br />
Boardings 157 78 47 281<br />
Downtown Petaluma<br />
Alightings 157 78 47 281<br />
Boardings 69 56 6 130<br />
North Novato<br />
Alightings 69 56 6 130<br />
Boardings 46 11 32 89<br />
South Novato<br />
Alightings 46 11 32 89<br />
Boardings 84 76 94 253<br />
Marin <strong>County</strong> Civic Center<br />
Alightings 84 76 94 253<br />
Boardings 80 52 157 288<br />
Downtown San Rafael<br />
Alightings 80 52 157 288<br />
Boardings 1,804 742 546 3,092<br />
GRAND TOTAL<br />
Alightings 1,804 742 546 3,092<br />
Source: MTC Model, Parsons Brinckerhoff<br />
5.4.3 Peak Period Ridership<br />
Figures 5.4-1 and 5.4-2 display schematic representations of AM peak period boardings and alightings<br />
for each SMART passenger rail alternative. Peak boardings and peak alightings represent the sum of<br />
peak drive access and peak walk access ridership at each rail station during the morning (AM) commute<br />
peak period. In the figures, on and off indicate boardings and alightings respectively, at each station<br />
stop. The numbers between station stops indicate total segment volumes (or loads) in the direction of<br />
<strong>travel</strong>. As seen from the figures, the ridership is heavier in the southbound direction of <strong>travel</strong> than in the<br />
northbound direction of <strong>travel</strong> during the morning peak period; the reverse takes place in the PM peak<br />
period.<br />
In the Cloverdale to Larkspur Alternative, illustrated in Figure 5.4-1, the peak period load point is in the<br />
southbound direction between the Santa Rosa-Jennings Avenue Station and the Downtown Santa Rosa<br />
Station with a load of 750 riders. In the southbound direction at both Windsor and Santa Rosa-Jennings<br />
Avenue stations it is estimated that there will be over 250 boardings during the AM peak period. In the<br />
northbound direction the AM peak period load point is about 300 and occurs between Rohnert Park and<br />
Downtown Santa Rosa stations.<br />
Similar to the Cloverdale to Larkspur Alternative, the MOS Alternative’s peak load point in the<br />
southbound direction is between the Santa Rosa stations; however the load is less with approximately<br />
<strong>Sonoma</strong>-Marin Area Rail Transit 35 Travel Demand Forecasting Report<br />
September 2005