travel demand forecasting report - Sonoma County Transportation ...
travel demand forecasting report - Sonoma County Transportation ...
travel demand forecasting report - Sonoma County Transportation ...

Create successful ePaper yourself
Turn your PDF publications into a flip-book with our unique Google optimized e-Paper software.
Appendix I: Travel Demand Forecasting Report<br />
5.2 System-Wide Transit Summary<br />
5.2.1 Daily Transit Trips<br />
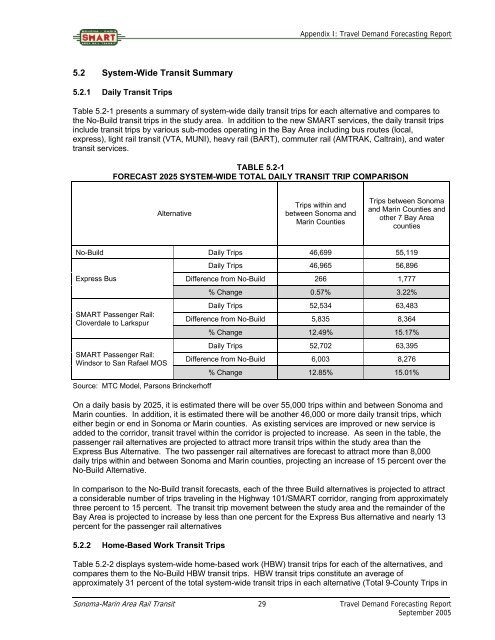
Table 5.2-1 presents a summary of system-wide daily transit trips for each alternative and compares to<br />
the No-Build transit trips in the study area. In addition to the new SMART services, the daily transit trips<br />
include transit trips by various sub-modes operating in the Bay Area including bus routes (local,<br />
express), light rail transit (VTA, MUNI), heavy rail (BART), commuter rail (AMTRAK, Caltrain), and water<br />
transit services.<br />
TABLE 5.2-1<br />
FORECAST 2025 SYSTEM-WIDE TOTAL DAILY TRANSIT TRIP COMPARISON<br />
Alternative<br />
Trips within and<br />
between <strong>Sonoma</strong> and<br />
Marin Counties<br />
Trips between <strong>Sonoma</strong><br />
and Marin Counties and<br />
other 7 Bay Area<br />
counties<br />
No-Build Daily Trips 46,699 55,119<br />
Express Bus<br />
SMART Passenger Rail:<br />
Cloverdale to Larkspur<br />
SMART Passenger Rail:<br />
Windsor to San Rafael MOS<br />
Source: MTC Model, Parsons Brinckerhoff<br />
Daily Trips 46,965 56,896<br />
Difference from No-Build 266 1,777<br />
% Change 0.57% 3.22%<br />
Daily Trips 52,534 63,483<br />
Difference from No-Build 5,835 8,364<br />
% Change 12.49% 15.17%<br />
Daily Trips 52,702 63,395<br />
Difference from No-Build 6,003 8,276<br />
% Change 12.85% 15.01%<br />
On a daily basis by 2025, it is estimated there will be over 55,000 trips within and between <strong>Sonoma</strong> and<br />
Marin counties. In addition, it is estimated there will be another 46,000 or more daily transit trips, which<br />
either begin or end in <strong>Sonoma</strong> or Marin counties. As existing services are improved or new service is<br />
added to the corridor, transit <strong>travel</strong> within the corridor is projected to increase. As seen in the table, the<br />
passenger rail alternatives are projected to attract more transit trips within the study area than the<br />
Express Bus Alternative. The two passenger rail alternatives are forecast to attract more than 8,000<br />
daily trips within and between <strong>Sonoma</strong> and Marin counties, projecting an increase of 15 percent over the<br />
No-Build Alternative.<br />
In comparison to the No-Build transit forecasts, each of the three Build alternatives is projected to attract<br />
a considerable number of trips <strong>travel</strong>ing in the Highway 101/SMART corridor, ranging from approximately<br />
three percent to 15 percent. The transit trip movement between the study area and the remainder of the<br />
Bay Area is projected to increase by less than one percent for the Express Bus alternative and nearly 13<br />
percent for the passenger rail alternatives<br />
5.2.2 Home-Based Work Transit Trips<br />
Table 5.2-2 displays system-wide home-based work (HBW) transit trips for each of the alternatives, and<br />
compares them to the No-Build HBW transit trips. HBW transit trips constitute an average of<br />
approximately 31 percent of the total system-wide transit trips in each alternative (Total 9-<strong>County</strong> Trips in<br />
<strong>Sonoma</strong>-Marin Area Rail Transit 29 Travel Demand Forecasting Report<br />
September 2005