travel demand forecasting report - Sonoma County Transportation ...
travel demand forecasting report - Sonoma County Transportation ...
travel demand forecasting report - Sonoma County Transportation ...

You also want an ePaper? Increase the reach of your titles
YUMPU automatically turns print PDFs into web optimized ePapers that Google loves.
Appendix I: Travel Demand Forecasting Report<br />
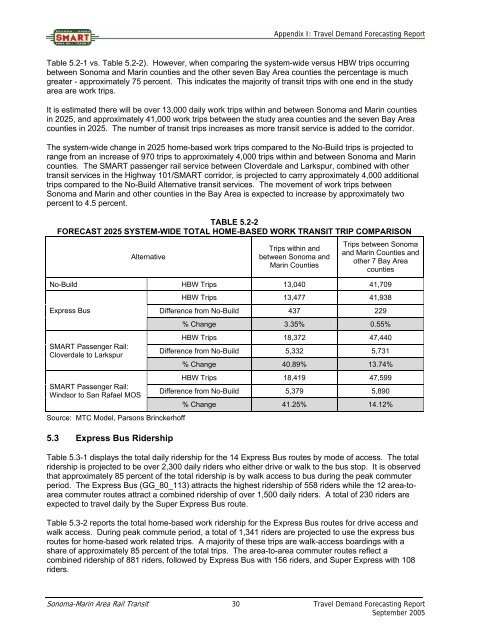
Table 5.2-1 vs. Table 5.2-2). However, when comparing the system-wide versus HBW trips occurring<br />
between <strong>Sonoma</strong> and Marin counties and the other seven Bay Area counties the percentage is much<br />
greater - approximately 75 percent. This indicates the majority of transit trips with one end in the study<br />
area are work trips.<br />
It is estimated there will be over 13,000 daily work trips within and between <strong>Sonoma</strong> and Marin counties<br />
in 2025, and approximately 41,000 work trips between the study area counties and the seven Bay Area<br />
counties in 2025. The number of transit trips increases as more transit service is added to the corridor.<br />
The system-wide change in 2025 home-based work trips compared to the No-Build trips is projected to<br />
range from an increase of 970 trips to approximately 4,000 trips within and between <strong>Sonoma</strong> and Marin<br />
counties. The SMART passenger rail service between Cloverdale and Larkspur, combined with other<br />
transit services in the Highway 101/SMART corridor, is projected to carry approximately 4,000 additional<br />
trips compared to the No-Build Alternative transit services. The movement of work trips between<br />
<strong>Sonoma</strong> and Marin and other counties in the Bay Area is expected to increase by approximately two<br />
percent to 4.5 percent.<br />
TABLE 5.2-2<br />
FORECAST 2025 SYSTEM-WIDE TOTAL HOME-BASED WORK TRANSIT TRIP COMPARISON<br />
Alternative<br />
Trips within and<br />
between <strong>Sonoma</strong> and<br />
Marin Counties<br />
Trips between <strong>Sonoma</strong><br />
and Marin Counties and<br />
other 7 Bay Area<br />
counties<br />
No-Build HBW Trips 13,040 41,709<br />
Express Bus<br />
SMART Passenger Rail:<br />
Cloverdale to Larkspur<br />
SMART Passenger Rail:<br />
Windsor to San Rafael MOS<br />
Source: MTC Model, Parsons Brinckerhoff<br />
5.3 Express Bus Ridership<br />
HBW Trips 13,477 41,938<br />
Difference from No-Build 437 229<br />
% Change 3.35% 0.55%<br />
HBW Trips 18,372 47,440<br />
Difference from No-Build 5,332 5,731<br />
% Change 40.89% 13.74%<br />
HBW Trips 18,419 47,599<br />
Difference from No-Build 5,379 5,890<br />
% Change 41.25% 14.12%<br />
Table 5.3-1 displays the total daily ridership for the 14 Express Bus routes by mode of access. The total<br />
ridership is projected to be over 2,300 daily riders who either drive or walk to the bus stop. It is observed<br />
that approximately 85 percent of the total ridership is by walk access to bus during the peak commuter<br />
period. The Express Bus (GG_80_113) attracts the highest ridership of 558 riders while the 12 area-toarea<br />
commuter routes attract a combined ridership of over 1,500 daily riders. A total of 230 riders are<br />
expected to <strong>travel</strong> daily by the Super Express Bus route.<br />
Table 5.3-2 <strong>report</strong>s the total home-based work ridership for the Express Bus routes for drive access and<br />
walk access. During peak commute period, a total of 1,341 riders are projected to use the express bus<br />
routes for home-based work related trips. A majority of these trips are walk-access boardings with a<br />
share of approximately 85 percent of the total trips. The area-to-area commuter routes reflect a<br />
combined ridership of 881 riders, followed by Express Bus with 156 riders, and Super Express with 108<br />
riders.<br />
<strong>Sonoma</strong>-Marin Area Rail Transit 30 Travel Demand Forecasting Report<br />
September 2005