RAMAN SCATTERING INTRODUCTION The Raman effect is the ...
RAMAN SCATTERING INTRODUCTION The Raman effect is the ...
RAMAN SCATTERING INTRODUCTION The Raman effect is the ...

You also want an ePaper? Increase the reach of your titles
YUMPU automatically turns print PDFs into web optimized ePapers that Google loves.
<strong>RAMAN</strong> <strong>SCATTERING</strong><br />
<strong>INTRODUCTION</strong><br />
<strong>The</strong> <strong>Raman</strong> <strong>effect</strong> <strong>is</strong> <strong>the</strong> appearance of weak lines in <strong>the</strong> spectrum of light scattered by a<br />
substance which has been illuminated by a monochromatic light (with angular frequency ω).<br />
<strong>The</strong> lines occur close to, and on each side of, <strong>the</strong> incident light frequency, and hence are optical<br />
sidebands. <strong>The</strong> sidebands ar<strong>is</strong>e from <strong>the</strong> nonlinear interaction of <strong>the</strong> light with atomic or<br />
molecular quantum states in <strong>the</strong> scattering material. In a classical picture, <strong>the</strong> light induces<br />
a dynamic (time dependent) response in <strong>the</strong> polarizability of <strong>the</strong> substance, and <strong>the</strong>n <strong>the</strong><br />
product of <strong>the</strong> polarizability with <strong>the</strong> original light field results in <strong>the</strong> optical sidebands. In a<br />
quantum mechanical picture, <strong>the</strong> nonlinearity <strong>is</strong> equivalent to second order time-dependent<br />
perturbation <strong>the</strong>ory. In th<strong>is</strong> case, one encounters a product involving a quantum state a<br />
with time dependence exp (−iω a t), <strong>the</strong> complex conjugate of a quantum state b with time<br />
dependence exp (iω b t) , and <strong>the</strong> electromagnetic field with time dependence cos(ωt). Using<br />
simple trig identities, one obtains a resultant time dependence cos [(w − (ω b − ω a ))t] and<br />
cos [(ω + (ω b − ω a ))t] . By analogy with <strong>the</strong> terminology used in fluorescence, <strong>the</strong> lines corresponding<br />
to a lower frequency are called Stokes lines and those corresponding to a higher<br />
frequency are called Anti-Stokes lines. By measuring <strong>the</strong> frequency shifts and ω b − ω a , <strong>the</strong><br />
structure of <strong>the</strong> system can be determined. [1–10]<br />
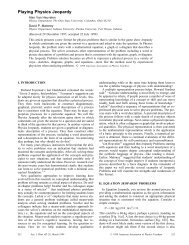
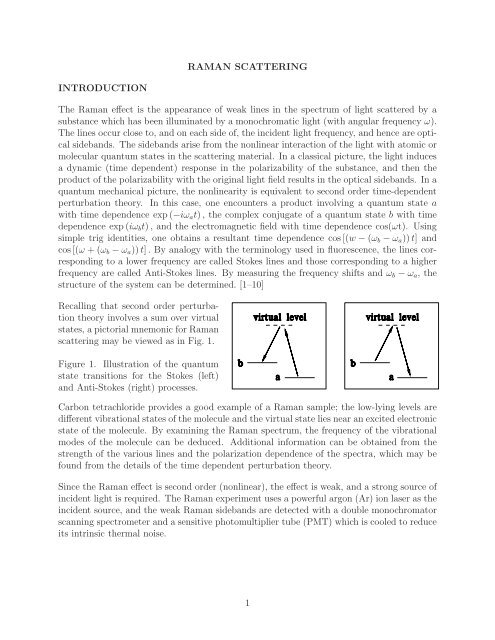
Recalling that second order perturbation<br />
<strong>the</strong>ory involves a sum over virtual<br />
states, a pictorial mnemonic for <strong>Raman</strong><br />
scattering may be viewed as in Fig. 1.<br />
Figure 1. Illustration of <strong>the</strong> quantum<br />
state transitions for <strong>the</strong> Stokes (left)<br />
and Anti-Stokes (right) processes.<br />
Carbon tetrachloride provides a good example of a <strong>Raman</strong> sample; <strong>the</strong> low-lying levels are<br />
different vibrational states of <strong>the</strong> molecule and <strong>the</strong> virtual state lies near an excited electronic<br />
state of <strong>the</strong> molecule. By examining <strong>the</strong> <strong>Raman</strong> spectrum, <strong>the</strong> frequency of <strong>the</strong> vibrational<br />
modes of <strong>the</strong> molecule can be deduced. Additional information can be obtained from <strong>the</strong><br />
strength of <strong>the</strong> various lines and <strong>the</strong> polarization dependence of <strong>the</strong> spectra, which may be<br />
found from <strong>the</strong> details of <strong>the</strong> time dependent perturbation <strong>the</strong>ory.<br />
Since <strong>the</strong> <strong>Raman</strong> <strong>effect</strong> <strong>is</strong> second order (nonlinear), <strong>the</strong> <strong>effect</strong> <strong>is</strong> weak, and a strong source of<br />
incident light <strong>is</strong> required. <strong>The</strong> <strong>Raman</strong> experiment uses a powerful argon (Ar) ion laser as <strong>the</strong><br />
incident source, and <strong>the</strong> weak <strong>Raman</strong> sidebands are detected with a double monochromator<br />
scanning spectrometer and a sensitive photomultiplier tube (PMT) which <strong>is</strong> cooled to reduce<br />
its intrinsic <strong>the</strong>rmal no<strong>is</strong>e.<br />
1
EQUIPMENT<br />
Oriel 6035 Hg(Ar) lamp with reference “Typical Spectra of Oriel Instruments”<br />
Coherent 31-2017 He-Ne laser (JDS Uniphase) and power supply<br />
IonLaser Technologies 5500A Ar ion laser<br />
Spex 1700-111 Spectrometer for measuring light spectra, with scanning power supplies<br />
Photomultiplier Tube (photomultiplier tutorial)<br />
Products for Research 375 photomultiplier socket and TE104 housing attached to<br />
spectrometer and amplifier, with PC104CE Peltier cooler<br />
Physics Electronics Shop HV Supply, Amplifier and D<strong>is</strong>criminator<br />
Agilent 53131A Universal Counter (operating guide, programming guide and<br />
service guide) (GPIB address 3)<br />
Computer with National Instruments LabVIEW and a data acqu<strong>is</strong>ition computer program<br />
(see C:\General Files\<strong>Raman</strong> files\raman datacq jdm.pdf)<br />
Lenses and samples (including carbon tetrachloride)<br />
Reference: <strong>Raman</strong> Handbook<br />
CAUTION: <strong>The</strong> Ar ion Laser can burn eyes, fingers, clothing, etc. Laser safety goggles<br />
must be worn at all times. Do not put shiny objects into <strong>the</strong> beam. Use care when aligning<br />
or realigning mirrors. Do all alignments at minimum power (see laser manual for details of<br />
power adjustment). Use bent pipes as optical dumps to stop stray laser light.<br />
In th<strong>is</strong> experiment, <strong>the</strong> <strong>Raman</strong> spectra will be measured for several liquids, starting with<br />
carbon tetrachloride (CCl 4 ). O<strong>the</strong>r liquids include chloroform (CHCl 3 ) and dichloromethane<br />
(CH 2 Cl 2 ).<br />
CAUTION: <strong>The</strong> <strong>Raman</strong> samples are contained in sealed glass vials, because <strong>the</strong>y are<br />
hazardous and create noxious odors. Be careful when handling <strong>the</strong> samples. It may be<br />
necessary to prepare fresh samples.<br />
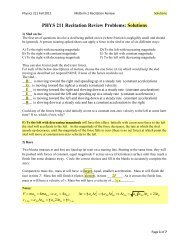
An illustration of <strong>the</strong> <strong>Raman</strong> scattering experiment <strong>is</strong> shown in Fig. 2. A moderate power<br />
He-Ne laser <strong>is</strong> used to align <strong>the</strong> optical system. <strong>The</strong> beam from <strong>the</strong> powerful Ar ion laser <strong>is</strong><br />
deflected upward by a mirror so as to pass through <strong>the</strong> <strong>Raman</strong> sample (not shown in th<strong>is</strong><br />
figure; <strong>the</strong> sample would be at <strong>the</strong> height of <strong>the</strong> He-Ne laser). Two lenses are used to focus<br />
an image of <strong>the</strong> scattered light inside <strong>the</strong> illuminated sample onto a narrow opening (slit)<br />
on <strong>the</strong> spectrometer. As d<strong>is</strong>cussed in <strong>the</strong> spectrometer manual, <strong>the</strong> spectrometer has three<br />
adjustable slits: an entrance slit, an internal slit, and an exit slit. <strong>The</strong> photomultiplier unit,<br />
2
which <strong>is</strong> optically sealed to <strong>the</strong> exit slit, cons<strong>is</strong>ts of <strong>the</strong> PMT, a housing, a socket base with<br />
coaxial connections for <strong>the</strong> PMT, and a <strong>the</strong>rmoelectric cooler with cables passing from <strong>the</strong><br />
housing.<br />
Figure 2. A schematic of <strong>the</strong> <strong>Raman</strong> scattering experiment.<br />
CAUTION: At times it may be necessary to open <strong>the</strong> cover of <strong>the</strong> spectrometer. Before<br />
opening <strong>the</strong> spectrometer, make sure <strong>the</strong> shutter in front of <strong>the</strong> PMT <strong>is</strong> closed, o<strong>the</strong>rw<strong>is</strong>e <strong>the</strong><br />
PMT may be ruined. <strong>The</strong> control knob for <strong>the</strong> shutter <strong>is</strong> located below <strong>the</strong> spectrometer exit<br />
slit. To close <strong>the</strong> shutter, turn <strong>the</strong> knob (it may be difficult to get it started) in <strong>the</strong> direction<br />
for loosening a right-hand screw until it clicks into place and a black line <strong>is</strong> centered in view.<br />
To open <strong>the</strong> shutter, turn in <strong>the</strong> direction for tightening a right-hand screw until it clicks<br />
into place and a red line <strong>is</strong> centered in view. Use <strong>the</strong> shutter on <strong>the</strong> entrance slit (which <strong>is</strong><br />
more accessible) as a model to see how <strong>the</strong> shutter works.<br />
CAUTION: Use only <strong>the</strong> side cover on <strong>the</strong> spectrometer (as shown in Fig. 2). Keep <strong>the</strong><br />
cover closed except when opening <strong>is</strong> absolutely necessary; dust <strong>is</strong> <strong>the</strong> biggest problem with<br />
<strong>the</strong> spectrometer. Also, never touch <strong>the</strong> surface of any optical component; <strong>the</strong>se surfaces<br />
cannot be cleaned.<br />
O<strong>the</strong>r equipment not shown in Fig. 2 includes a) a computer for data acqu<strong>is</strong>ition; b) a device<br />
made by <strong>the</strong> Physics Department Electronics Shop containing a high voltage (HV) power<br />
supply connected <strong>the</strong> PMT cathode with a coaxial cable having special high-voltage BNC<br />
connectors, a preamplifier and d<strong>is</strong>criminator connected to <strong>the</strong> PMT anode (signal output)<br />
with a BNC cable, and a BNC output for sending pulses to a frequency (pulse rate) counter;<br />
c) a power supply connected to <strong>the</strong> <strong>the</strong> PMT <strong>the</strong>rmoelectric cooler; and d) a scan control<br />
unit for <strong>the</strong> spectrometer. Two small digital multimeters (DMM’s) are connected to <strong>the</strong> Ar<br />
3
laser and <strong>the</strong> PMT cooler power supply.<br />
It should be noted that <strong>the</strong> scanning of wavelengths to produce <strong>the</strong> spectrum <strong>is</strong> accompl<strong>is</strong>hed<br />
by rotating <strong>the</strong> spectrometer gratings with a motor controlled by <strong>the</strong> scan control unit. <strong>The</strong><br />
degree of rotation <strong>is</strong> indicated by a counter on <strong>the</strong> side of <strong>the</strong> spectrometer. Determining<br />
a conversion from counter reading to wavelength (i.e. <strong>the</strong> calibration of <strong>the</strong> counter) <strong>is</strong> an<br />
important part of <strong>the</strong> procedure.<br />
PROCEDURE<br />
1. <strong>The</strong> first step <strong>is</strong> to check <strong>the</strong> status of <strong>the</strong> PMT <strong>the</strong>rmoelectric cooler. <strong>The</strong> cooler<br />
<strong>is</strong> based on <strong>the</strong> <strong>the</strong>rmoelectric <strong>effect</strong>, in which a DC electric potential difference generates<br />
a temperature gradient; by anchoring <strong>the</strong> high end of <strong>the</strong> gradient near room<br />
temperature with a flowing water heat exchanger, <strong>the</strong> low temperature end of <strong>the</strong> gradient<br />
can be used to cool <strong>the</strong> PMT. <strong>The</strong> <strong>the</strong>rmoelectric <strong>effect</strong> <strong>is</strong> reversible, so that a<br />
temperature gradient can generate a potential difference. <strong>The</strong>re are some difficulties<br />
with th<strong>is</strong> cooler, so that it cannot be turned on until two checks are performed. <strong>The</strong><br />
reason <strong>is</strong> that <strong>the</strong> cooler may have been used earlier, and <strong>the</strong> heat exchange water may<br />
have been stopped when <strong>the</strong> cooler was turned off. Th<strong>is</strong> may result in two problems.<br />
<strong>The</strong> first problem <strong>is</strong> that parts of <strong>the</strong> cooler which remain cold after shut-down may<br />
cause <strong>the</strong> water (no longer flowing) to freeze and plug <strong>the</strong> heat exchanger. <strong>The</strong> second<br />
problem <strong>is</strong> that <strong>the</strong> residual temperature gradient may establ<strong>is</strong>h an electric potential<br />
across <strong>the</strong> leads connected to <strong>the</strong> cooler power supply, with <strong>the</strong> consequence that when<br />
<strong>the</strong> power supply <strong>is</strong> turned on, <strong>the</strong> extra potential causes too much current to flow,<br />
and a fuse <strong>is</strong> blown. <strong>The</strong> steps to check <strong>the</strong> status of <strong>the</strong> cooler are as follows:<br />
1. Turn on <strong>the</strong> DMM connected to <strong>the</strong> PMT cooler power supply (which should be<br />
off), and set it to measure DC voltage. <strong>The</strong> absolute value of <strong>the</strong> voltage should<br />
be less than 0.1V; if not, <strong>the</strong>re may be a residual temperature gradient on <strong>the</strong><br />
<strong>the</strong>rmoelectric cooler, and you must wait until it reduces.<br />
2. Follow <strong>the</strong> rubber tubing from <strong>the</strong> PMT housing to <strong>the</strong> source of <strong>the</strong> heat exchanger<br />
water at a green-handled ball valve on a back wall near <strong>the</strong> floor. Turn<br />
on <strong>the</strong> water by rotating <strong>the</strong> green handle until it <strong>is</strong> parallel to <strong>the</strong> outlet pipe. Do<br />
not alter <strong>the</strong> round-handled throttling valve which <strong>is</strong> upstream from <strong>the</strong> greenhandled<br />
ball valve. Water should exit <strong>the</strong> o<strong>the</strong>r rubber tube into a drain pipe,<br />
and <strong>the</strong> lights on a safety flow switch mounted on <strong>the</strong> wall near <strong>the</strong> PMT housing<br />
should change from red to green. If water does not flow, <strong>the</strong> PMT cooler may be<br />
plugged with ice, and you will have to wait until it melts. If <strong>the</strong> water does flow,<br />
turn it off by rotating <strong>the</strong> green handle until it <strong>is</strong> perpendicular to <strong>the</strong> outlet pipe.<br />
Note that <strong>the</strong> water <strong>is</strong> filtered, and that <strong>the</strong> filter should be replaced if it appears<br />
dirty.<br />
If <strong>the</strong> checks indicate that <strong>the</strong> PMT cooler <strong>is</strong> operational, do not turn on <strong>the</strong> power<br />
supply at th<strong>is</strong> point. Also do not turn on <strong>the</strong> water at th<strong>is</strong> point.<br />
3. Check that <strong>the</strong> spectrometer exit slit shutter (at <strong>the</strong> PMT unit) <strong>is</strong> closed. With <strong>the</strong><br />
4
PMT high voltage power supply turned off, make sure <strong>the</strong> HV SET knob <strong>is</strong> turned all<br />
<strong>the</strong> way down (to zero). Turn on <strong>the</strong> PMT high voltage power supply and turn up <strong>the</strong><br />
HV SET knob until <strong>the</strong> voltage on <strong>the</strong> meter reaches 900 V (<strong>the</strong> actual output voltage<br />
<strong>is</strong> negative); set <strong>the</strong> d<strong>is</strong>criminator to 3.0. Using <strong>the</strong> PMT OUT and TRIGGER OUT<br />
connections, check <strong>the</strong> pulses from <strong>the</strong> PMT with <strong>the</strong> oscilloscope. Note <strong>the</strong> nature<br />
(shape, amplitude, width)of <strong>the</strong> pulses for your report. Also check <strong>the</strong> rear panel<br />
PULSE OUT POSITIVE 4 V signal; connect th<strong>is</strong> output to channel 1 of <strong>the</strong> frequency<br />
counter.<br />
4. Turn on <strong>the</strong> frequency counter which d<strong>is</strong>plays <strong>the</strong> pulse rate from <strong>the</strong> PMT (through<br />
<strong>the</strong> HV supply, preamp and d<strong>is</strong>criminator unit). Use channel 1, and use <strong>the</strong> “O<strong>the</strong>r<br />
Meas” botton to put <strong>the</strong> counter into <strong>the</strong> “TOTALIZE 1” mode. Set <strong>the</strong> gate time to<br />
1 s, <strong>the</strong> auto-trigger to OFF and <strong>the</strong> trigger sensitivity to LO (see <strong>the</strong> Quick Reference<br />
Guide in <strong>the</strong> manual). Based on <strong>the</strong> nature of <strong>the</strong> PULSE OUT POSITIVE 4 V signal<br />
from <strong>the</strong> HV/preamp/d<strong>is</strong>criminator unit, set <strong>the</strong> frequency counter input coupling,<br />
trigger level and trigger slope. In your lab report, you should d<strong>is</strong>cuss why all of <strong>the</strong>se<br />
counter settings have <strong>the</strong>ir particular values.<br />
5. Log on to <strong>the</strong> computer and start <strong>the</strong> <strong>Raman</strong> computer program by running <strong>the</strong> program<br />
C:\General Files\<strong>Raman</strong> files\raman datacq jdm.vi. For now, <strong>the</strong> Spectrometer<br />
Start Reading and Spectrometer End Reading are not necessary. Click <strong>the</strong> right arrow<br />
at <strong>the</strong> upper-left of <strong>the</strong> d<strong>is</strong>play to start <strong>the</strong> program. <strong>The</strong> program’s “Photomultiplier<br />
pulse rate” readout should match <strong>the</strong> d<strong>is</strong>play of <strong>the</strong> frequency counter.<br />
With <strong>the</strong> PMT shutter closed, <strong>the</strong> count rate may have values in <strong>the</strong> range of a few<br />
hundred to 1500 counts-per-second (cps). Th<strong>is</strong> <strong>is</strong> <strong>the</strong> room temperature PMT dark<br />
current count rate. <strong>The</strong> data acqu<strong>is</strong>ition mode may be exited at <strong>the</strong> end of <strong>the</strong> run (or<br />
at any earlier time) by clicking <strong>the</strong> Stop button. Leave it running for now.<br />
6. Turn on <strong>the</strong> water to <strong>the</strong> PMT cooler, and turn on <strong>the</strong> PMT cooler power supply.<br />
As <strong>the</strong> PMT tube cools down, you should see its dark current count rate decrease,<br />
reaching values of less than 10 cps in 30 to 45 minutes. You can monitor <strong>the</strong> PMT<br />
cool-down with <strong>the</strong> count rate given by <strong>the</strong> frequency counter or <strong>the</strong> computer.<br />
7. Near <strong>the</strong> end of <strong>the</strong> PMT cool-down, you can check for light leaks. Close <strong>the</strong> cover on<br />
<strong>the</strong> scanning spectrometer if it <strong>is</strong> open (as shown in Fig. 2), close <strong>the</strong> entrance slit,<br />
open <strong>the</strong> internal and exit slits, and finally open <strong>the</strong> shutter on <strong>the</strong> exit slit. Turn <strong>the</strong><br />
room lights on and off; <strong>the</strong> PMT signal should remain below 10 cps. If not, you may<br />
have to work with <strong>the</strong> lights out in <strong>the</strong> curtained <strong>Raman</strong> area, and use a flashlight.<br />
When <strong>the</strong> light check <strong>is</strong> done, close <strong>the</strong> shutter on <strong>the</strong> exit slit.<br />
Alignment of <strong>the</strong> optical system<br />
1. While <strong>the</strong> PMT <strong>is</strong> cooling down, <strong>the</strong> optical system may be aligned. Remove <strong>the</strong> two<br />
lenses from <strong>the</strong>ir bases. After making sure <strong>the</strong> shutter on <strong>the</strong> exit slit <strong>is</strong> closed, open<br />
<strong>the</strong> cover to <strong>the</strong> spectrometer (as shown in Fig. 2) and place a cardboard d<strong>is</strong>k (with<br />
marks indicating its center) over <strong>the</strong> first mirror (opposite <strong>the</strong> entrance slit). Open <strong>the</strong><br />
5
spectrometer entrance slit to almost fully open.<br />
CAUTION: Laser safety goggles must be worn from th<strong>is</strong> point on.<br />
Turn on <strong>the</strong> He-Ne laser, and adjust its position so that its beam passes through <strong>the</strong><br />
center of <strong>the</strong> entrance slit and falls on <strong>the</strong> center of <strong>the</strong> d<strong>is</strong>k at <strong>the</strong> first mirror. Th<strong>is</strong><br />
defines <strong>the</strong> optical ax<strong>is</strong> for <strong>the</strong> spectrometer.<br />
2. Turn on <strong>the</strong> DMM connected to <strong>the</strong> Ar ion laser, so it can be used to monitor <strong>the</strong> laser’s<br />
anode current; use <strong>the</strong> laser’s manual to determine how <strong>the</strong> DMM reading relates to<br />
<strong>the</strong> anode current. Be careful that <strong>the</strong> current never exceeds 95% of <strong>the</strong> maximum<br />
rating found in <strong>the</strong> laser’s manual. You may find that <strong>the</strong> anode current creeps slowly<br />
with time, so monitor it and adjust as necessary.<br />
Using <strong>the</strong> instructions in <strong>the</strong> manual, turn on <strong>the</strong> Ar ion laser, and adjust <strong>the</strong> anode<br />
current to its minimum (<strong>the</strong> Ar laser beam should still be v<strong>is</strong>ible). <strong>The</strong> Ar laser beam<br />
should be deflected upward by <strong>the</strong> Ar laser mirror, shown in Fig. 2. Adjust <strong>the</strong> position<br />
of <strong>the</strong> cardboard pointer (illustrated in Fig. 2) so that both <strong>the</strong> He-Ne laser beam and<br />
<strong>the</strong> Ar laser beam are v<strong>is</strong>ible near <strong>the</strong> tip of <strong>the</strong> pointer. Turn <strong>the</strong> adjustment screws<br />
on <strong>the</strong> Ar laser mirror so that <strong>the</strong> deflected Ar laser beam <strong>is</strong> vertical and intersects <strong>the</strong><br />
He-Ne laser; it may be helpful to adjust <strong>the</strong> cardboard pointer so that its tip <strong>is</strong> just<br />
illuminated by both laser beams. A plumb line may be used to see if <strong>the</strong> deflected Ar<br />
laser beam <strong>is</strong> vertical. After aligning <strong>the</strong> Ar laser beam, <strong>the</strong> cardboard pointer may be<br />
removed.<br />
3. Install <strong>the</strong> 8.1 cm focal length lens into <strong>the</strong> lens-holder base nearest <strong>the</strong> Ar laser beam,<br />
so that <strong>the</strong> He-Ne laser beam passes through near <strong>the</strong> center of <strong>the</strong> lens. Adjust <strong>the</strong><br />
base so that <strong>the</strong> lens <strong>is</strong> about 10 cm from <strong>the</strong> Ar laser beam. Use <strong>the</strong> fine positioning<br />
adjustments on <strong>the</strong> base so that <strong>the</strong> He-Ne laser beam again falls on <strong>the</strong> center of <strong>the</strong><br />
first spectrometer mirror.<br />
4. Install <strong>the</strong> 44.7 cm focal length lens into <strong>the</strong> second lens-holder base so that <strong>the</strong> He-Ne<br />
laser beam passes through near <strong>the</strong> center of th<strong>is</strong> lens. Adjust <strong>the</strong> base so that th<strong>is</strong><br />
lens <strong>is</strong> about 10 cm from <strong>the</strong> first lens. Use <strong>the</strong> fine positioning adjustments on <strong>the</strong><br />
base so <strong>the</strong> <strong>the</strong> He-Ne laser beam again falls on <strong>the</strong> center of <strong>the</strong> first spectrometer<br />
mirror. Slide <strong>the</strong> bases of both mirrors back and forth about 1 cm and see that <strong>the</strong><br />
He-Ne laser beam remains near <strong>the</strong> center of <strong>the</strong> first spectrometer mirror; if not, <strong>the</strong><br />
beam supporting <strong>the</strong> lens bases must be re-aligned.<br />
5. <strong>The</strong> <strong>Raman</strong> sample holder <strong>is</strong> a metal cylinder (with an inside diameter of about 1 cm,<br />
and an opening on one side) with a stand positioning it at about <strong>the</strong> same height as <strong>the</strong><br />
cardboard pointer tip. Place a strip of cardboard inside <strong>the</strong> sample holder and position<br />
it so that <strong>the</strong> deflected Ar laser beam produces a ∼2 cm streak along <strong>the</strong> cardboard<br />
strip which can be seen when viewed through <strong>the</strong> opening in <strong>the</strong> holder; <strong>the</strong> opening<br />
should be facing <strong>the</strong> lenses. Adjust <strong>the</strong> positions of <strong>the</strong> lens bases so that th<strong>is</strong> streak<br />
<strong>is</strong> imaged at <strong>the</strong> spectrometer entrance slit. Th<strong>is</strong> should maximize <strong>the</strong> amount of light<br />
which falls on <strong>the</strong> first spectrometer mirror. <strong>The</strong> optical system <strong>is</strong> now aligned.<br />
6
Calibration of <strong>the</strong> scanning spectrometer<br />
Before doing any <strong>Raman</strong> scattering experiment, it <strong>is</strong> necessary to become familiar with <strong>the</strong><br />
scanning spectrometer, and to calibrate <strong>the</strong> scanning motor counter against <strong>the</strong> wavelength.<br />
<strong>The</strong> calibration can be accompl<strong>is</strong>hed using <strong>the</strong> He-Ne laser, <strong>the</strong> Ar laser, and <strong>the</strong> known<br />
lines from a mercury (Hg) lamp. A calibration graph should be made for future reference.<br />
<strong>The</strong> slope of <strong>the</strong> calibration line should be a ratio of two small integers. <strong>The</strong> reason <strong>is</strong> that<br />
at some point a grating inside <strong>the</strong> spectrometer was replaced; <strong>the</strong> old and new gratings had<br />
standard line densities, but <strong>the</strong>y were two different standards, which differed by <strong>the</strong> ratio of<br />
two small integers.<br />
1. Read <strong>the</strong> manual for <strong>the</strong> scanning spectrometer. <strong>The</strong> scanning <strong>is</strong> accompl<strong>is</strong>hed by<br />
a prec<strong>is</strong>ion motor drive, which <strong>is</strong> controlled by a unit external to <strong>the</strong> spectrometer.<br />
Always make measurements in <strong>the</strong> same scan direction to minimize <strong>the</strong> <strong>effect</strong>s of screw<br />
lag. Note that starting or stopping <strong>the</strong> motor drive at high speed can ruin your<br />
calibration; always start or stop <strong>the</strong> drive at low speeds (approximately 10 on <strong>the</strong><br />
control unit dial read-out), slowly accelerating or decelerating to <strong>the</strong> desired speed.<br />
Note that <strong>the</strong> scanning spectrometer needs electrical power, and it <strong>is</strong> turned on by<br />
plugging its power cord into a wall socket or switched outlet; when shutting down <strong>the</strong><br />
experiment, remember to turn off <strong>the</strong> scan control unit. When <strong>the</strong> scan control <strong>is</strong> on,<br />
lights near <strong>the</strong> scanning motor counter on <strong>the</strong> side of <strong>the</strong> spectrometer should turn on.<br />
If <strong>the</strong> counter lights are off when <strong>the</strong> spectrometer <strong>is</strong> on, <strong>the</strong>n use a DMM to check<br />
connections, bulbs, etc. in <strong>the</strong> vicinity of <strong>the</strong> counter.<br />
2. Using a strip of paper, trace <strong>the</strong> light from <strong>the</strong> Ar laser (which should be present<br />
as a result of <strong>the</strong> optics alignment procedure) through <strong>the</strong> first monochromator; it<br />
may be necessary to turn off <strong>the</strong> room lights. Run <strong>the</strong> spectrometer’s scanning motor<br />
(rotating <strong>the</strong> gratings) so that <strong>the</strong> scattered light from <strong>the</strong> Ar laser falls on <strong>the</strong> internal<br />
slit. Note <strong>the</strong> scanning motor counter reading; th<strong>is</strong> gives <strong>the</strong> approximate position for<br />
<strong>the</strong> subsequent calibration at th<strong>is</strong> wavelength.<br />
Note that <strong>the</strong> Ar ion laser may be tuned to produce different wavelengths of light. From<br />
<strong>the</strong> <strong>Raman</strong> Handbook, find <strong>the</strong> relative intensities, wavelengths and <strong>the</strong> coresponding<br />
colors of <strong>the</strong> four strongest lines for an Ar ion laser.<br />
In order to identify <strong>the</strong> spectral lines from <strong>the</strong> various claibration light sources, it<br />
may be useful to use <strong>the</strong> following table which gives common color names for different<br />
wavelengths of light:<br />
wavelength range (nm) color name<br />
400.0 - 424.0 violet<br />
424.0 - 491.2 blue<br />
491.2 - 575.0 green<br />
575.0 - 585.0 yellow<br />
585.0 - 647.0 orange<br />
647.0 - 700.0 red<br />
7
3. Close <strong>the</strong> cover of <strong>the</strong> scanning spectrometer, and set <strong>the</strong> internal and exit slit openings<br />
to 0.3 mm. Close <strong>the</strong> entrance slit opening to zero. <strong>The</strong> PMT cool-down data acqu<strong>is</strong>ition<br />
on <strong>the</strong> computer should have completed. [You should save <strong>the</strong> cool-down data<br />
for your lab report.] Restart <strong>the</strong> computer data acqu<strong>is</strong>ition as for <strong>the</strong> PMT cool-down,<br />
and recheck that <strong>the</strong> PMT has cooled down so that its dark current <strong>is</strong> below 10 cps.<br />
Open <strong>the</strong> shutter on <strong>the</strong> exit slit, and slowly open <strong>the</strong> entrance slit; <strong>the</strong> count rate from<br />
<strong>the</strong> PMT should increase. Use <strong>the</strong> scanning spectrometer motor drive to position <strong>the</strong><br />
monochromator for a maximum count rate. Increase <strong>the</strong> entrance slit opening until<br />
0.3 mm <strong>is</strong> reached, or <strong>the</strong> count rate reaches 10 5 cps, whichever comes first.<br />
CAUTION: Never let <strong>the</strong> PMT count rate exceed 10 6 cps.<br />
4. Rewind <strong>the</strong> spectrometer scanning motor away from <strong>the</strong> approximate position for <strong>the</strong><br />
Ar laser wavelength so that <strong>the</strong> count rate drops to <strong>the</strong> background rate (near or at<br />
<strong>the</strong> dark current rate). For <strong>the</strong> calibration you will want to scan through <strong>the</strong> Ar laser<br />
wavelength to acquire a fully resolved peak. You will want to use a position where<br />
<strong>the</strong> PMT <strong>is</strong> at <strong>the</strong> background rate as your desired starting position for <strong>the</strong> scanning<br />
motor counter when initiating <strong>the</strong> calibration scan; make a note of th<strong>is</strong> desired starting<br />
position.<br />
NOTE: <strong>The</strong> resolution of <strong>the</strong> spectrometer depends critically on <strong>the</strong> width of <strong>the</strong><br />
various slits in <strong>the</strong> spectrometer and, in general, reducing <strong>the</strong> slit width will both<br />
increase <strong>the</strong> resolution and decrease <strong>the</strong> signal to <strong>the</strong> PMT. Also, weak peaks, possibly<br />
next to a strong peak, will require longer scan times. <strong>The</strong>se aspects should be kept in<br />
mind when <strong>the</strong> scans for <strong>Raman</strong> lines are performed.<br />
To obtain good calibration peaks, you should try different values for <strong>the</strong> spectrometer<br />
scanning motor speed and <strong>the</strong> slit openings.<br />
Concerning <strong>the</strong> computer data acqu<strong>is</strong>ition, it should be noted that <strong>the</strong> PMT pulse rate<br />
(<strong>the</strong> “y-ax<strong>is</strong>” of a spectrum) <strong>is</strong> recorded by <strong>the</strong> computer, but <strong>the</strong>re <strong>is</strong> no connection<br />
between scanning counter (<strong>the</strong> “x-ax<strong>is</strong>” of a spectrum) and <strong>the</strong> computer. <strong>The</strong> x-ax<strong>is</strong><br />
<strong>is</strong> obtained by assuming that both <strong>the</strong> wavelength scanning (represented by <strong>the</strong> counter<br />
advance) and <strong>the</strong> data acqu<strong>is</strong>ition by <strong>the</strong> computer occur at constant rates in time. In<br />
<strong>the</strong> computer program you will enter <strong>the</strong> counter reading when data acqu<strong>is</strong>ition begins<br />
(Spectrometer Start Reading) and <strong>the</strong> counter reading when <strong>the</strong> data acqu<strong>is</strong>ition ends<br />
(Spectrometer End Reading); with th<strong>is</strong> information, <strong>the</strong> computer program <strong>is</strong> able to<br />
convert its time sequence of data into a l<strong>is</strong>t of PMT pulse rates versus counter reading.<br />
To take data for a spectrum, open <strong>the</strong> raman datacq jdm.vi program (if it <strong>is</strong> not<br />
open already). With <strong>the</strong> spectrometer scanning motor running, enter an approaching<br />
counter reading as <strong>the</strong> Spectrometer Start Reading; when <strong>the</strong> counter just reaches <strong>the</strong><br />
Start Reading, click <strong>the</strong> program start arrow. <strong>The</strong> Spectrometer End reading may be<br />
entered after <strong>the</strong> program begins running, but it must be entered before clicking <strong>the</strong><br />
Stop button. Click on <strong>the</strong> Stop button when <strong>the</strong> spectrometer counter just reaches<br />
<strong>the</strong> End Reading. <strong>The</strong> program will not automatically stop at <strong>the</strong> end reading. If you<br />
leave <strong>the</strong> experiment unattended and find that you have overshot <strong>the</strong> End Reading,<br />
8
<strong>the</strong>n enter an approaching counter reading and click Stop when <strong>the</strong> new End Reading<br />
<strong>is</strong> reached. After stopping <strong>the</strong> scan, <strong>the</strong> program will prompt for a filename for storing<br />
<strong>the</strong> data; <strong>the</strong> file will have two columns of numbers: <strong>the</strong> counter reading (as calculated<br />
by assuming constant counter and data acqu<strong>is</strong>ition rates) and <strong>the</strong> PMT pulse rate<br />
(proportional to <strong>the</strong> scattered light intensity).<br />
Repeat <strong>the</strong> calibration procedure above replacing <strong>the</strong> light from <strong>the</strong> Ar ion laser with light<br />
from <strong>the</strong> He-Ne laser and several strong lines (two yellows and a green) of known wavelength<br />
from a Hg lamp. Set up <strong>the</strong> Hg lamp so that it shines strongly into <strong>the</strong> spectrometer entrance<br />
slit. When scanning a new spectrum, you can clear a previous scan in <strong>the</strong> computer program<br />
d<strong>is</strong>play by following <strong>the</strong> directions below <strong>the</strong> program d<strong>is</strong>play.<br />
CAUTION: Ultraviolet light from <strong>the</strong> Hg lamp <strong>is</strong> harmful; do not look at it when on, and<br />
keep it covered to avoid accidents.<br />
<strong>The</strong> calibration will be given as a straight line fit of <strong>the</strong> actual wavelength of <strong>the</strong> incident<br />
light as a function of <strong>the</strong> counter value at <strong>the</strong> peaks of <strong>the</strong> calibration data sets. After an<br />
initial calibration with strong, obvious lines, you may want to look for some weaker lines<br />
from <strong>the</strong> Hg lamp. For some Hg lines and for <strong>the</strong> <strong>Raman</strong> measurement, it may be necessary<br />
to increase <strong>the</strong> spectrometer slit openings.<br />
Note that <strong>the</strong>re are several types of Hg lamps, with different spectra. Also, if <strong>the</strong> counting<br />
rate <strong>is</strong> too high (too much light <strong>is</strong> entering <strong>the</strong> spectrometer) <strong>the</strong>n you may get too many<br />
unidentifiable lines. If necessary, close down <strong>the</strong> entrance slit; recall that <strong>the</strong> maximum<br />
count rate should be below 10 6 cps. Finally note that some strong lines from <strong>the</strong> Hg lamp<br />
may place second order diffraction peaks in your spectra. An initial calibration with strong,<br />
obvious lines will alleviate line identification problems.<br />
<strong>Raman</strong> data acqu<strong>is</strong>ition<br />
<strong>The</strong> liquid samples for <strong>Raman</strong> scattering measurements are placed in transparent vials which<br />
fit into <strong>the</strong> sample holder. <strong>The</strong> side of a vial may be partially covered with aluminum foil<br />
to increase <strong>the</strong> amount of scattered light sent to <strong>the</strong> lenses. When placing <strong>the</strong> vials into <strong>the</strong><br />
sample holder, some wedging material may be used so that <strong>the</strong> vials do not shift during data<br />
acqu<strong>is</strong>ition. Recall that <strong>the</strong> light scattered from <strong>the</strong> samples will have an intense Rayleigh<br />
line in addition to <strong>the</strong> much weaker <strong>Raman</strong> sidebands. Adjust <strong>the</strong> position of <strong>the</strong> sample<br />
holder (and <strong>the</strong> position of <strong>the</strong> sample vial within <strong>the</strong> holder as well) in order to obtain <strong>the</strong><br />
maximum signal from <strong>the</strong> Rayleigh line.<br />
For <strong>the</strong> <strong>Raman</strong> data acqu<strong>is</strong>ition scans, <strong>the</strong> Ar ion laser anode current should be increased to<br />
95% of its maximum rating. <strong>The</strong>n perform a slow scan of an appropriate range of wavelengths<br />
to look for <strong>the</strong> <strong>Raman</strong> lines. If you have trouble finding <strong>the</strong> <strong>Raman</strong> lines, you might want<br />
to look up <strong>the</strong> known values of <strong>the</strong> wavelength shifts to make sure you are scanning over <strong>the</strong><br />
correct range. If you have carefully adjusted <strong>the</strong> optics, maximized <strong>the</strong> Ar ion laser output,<br />
and varied <strong>the</strong> sample vial position and you cannot see <strong>Raman</strong> lines or <strong>the</strong>y are very faint<br />
and hard to d<strong>is</strong>cern, you may want to try adjusting <strong>the</strong> alignment of <strong>the</strong> mirrors internal to<br />
9
<strong>the</strong> laser head, but only as a last resort. Consult <strong>the</strong> lab instructor before attempting th<strong>is</strong>,<br />
as it <strong>is</strong> easy to throw <strong>the</strong> laser off its tuning.<br />
INSTRUCTORS ONLY: <strong>The</strong> B screw in <strong>the</strong> back of <strong>the</strong> ion laser (see <strong>the</strong> manual link<br />
under EQUIPMENT above), if tweaked, will change <strong>the</strong> frequency of <strong>the</strong> laser output light.<br />
If only adjustments of <strong>the</strong> mirror alignments are desired, <strong>the</strong> A screws and <strong>the</strong> B screw in<br />
<strong>the</strong> front of <strong>the</strong> laser can be very slightly tweaked while monitoring <strong>the</strong> current draw to<br />
minimize <strong>the</strong> current (a very slight adjustment makes a huge impact on current draw). To<br />
avoid accidentally blowing <strong>the</strong> fuse, th<strong>is</strong> adjustment should be done only at low currents<br />
(e.g. 7 A). Once <strong>the</strong> current draw has been minimized, it can be set back to 10 - 11 A.<br />
References<br />
[1] J. Loader, Basic Laser <strong>Raman</strong> Spectroscopy (Heyden & Son, London, 1970).<br />
[2] D. Long, <strong>Raman</strong> Spectroscopy (McGraw-Hill, New York, 1971).<br />
[3] T. R. Gilson and P. J. Hendra, Laser <strong>Raman</strong> Spectroscopy (Wiley, London, 1970).<br />
[4] A. Anderson, ed., <strong>The</strong> <strong>Raman</strong> Effect (Marcel Dekker, New York, 1971).<br />
[5] R. Chang, Basic Principles of Spectroscopy (McGraw-Hill, New York, 1971).<br />
[6] W. Demtroder, Laser Spectroscopy Basic Concepts and Instrumentation (Springer Verlag,<br />
Berlin, 1988).<br />
[7] S. Walker and H. Straw, Spectroscopy (Chapman and Hill, London, 1962) Vol. 2, p. 176.<br />
[8] B. P. Straughan and S. Walker, Spectroscopy (Chapman and Hill, London, 1962), Vol.<br />
2, 198, pg 225-258.<br />
[9] C.V. <strong>Raman</strong> and K.S. Kr<strong>is</strong>hnan, Indian J. Phys. 2, 387 (1928).<br />
[10] G. Herzberg, Infrared and <strong>Raman</strong> Spectra of Polyatomic Molecules (Van Nostrand, New<br />
York, 1945).<br />
10