The Oscilloscope and AC Circuits (Lab 09)
The Oscilloscope and AC Circuits (Lab 09)
The Oscilloscope and AC Circuits (Lab 09)
- No tags were found...

You also want an ePaper? Increase the reach of your titles
YUMPU automatically turns print PDFs into web optimized ePapers that Google loves.
Goals:<br />
<br />
<br />
<br />
<strong>The</strong> <strong>Oscilloscope</strong> <strong>and</strong> <strong>AC</strong> <strong>Circuits</strong><br />
To learn to use an oscilloscope as a DC voltmeter.<br />
To learn to use an oscilloscope to study periodic signals.<br />
To see how the oscillation amplitude of a series RLC circuit depends upon the driving<br />
frequency <strong>and</strong> exhibits resonance at a particular frequency.<br />
Equipment:<br />
<br />
<br />
<br />
<br />
<br />
Science Workshop Interface & voltage probes<br />
Phys212 <strong>Lab</strong>Kit Battery module<br />
<strong>Oscilloscope</strong> w/ probes<br />
RLC circuit board<br />
Software: DataStudio, Microsoft Excel<br />
Introduction:<br />
<strong>The</strong> oscilloscope is an extremely useful instrument for measuring electrical signals that vary with<br />
time. <strong>The</strong> conventional oscilloscope is essentially like a TV set: it consists of an electron gun that<br />
accelerates a beam of electrons towards a phosphor screen (say, along the z-direction). <strong>The</strong> beam<br />
is deflected in the x-y plane by two sets of plates that provide an electric field. To measure a<br />
voltage V that varies in a regular manner with time, we provide a periodic voltage to the x-plates<br />
that "sweeps" the electron beam from one side of the phosphor screen to the other — when it<br />
reaches the far right side, the beam snaps back to its starting position. <strong>The</strong>n, to measure the<br />
waveform of the signal V, we provide the voltage to the y-plates, so that the electron beam goes<br />
up <strong>and</strong> down, depending on the supplied voltage. When these two motions are combined, the net<br />
result is a "trace" on the phosphor screen that shows the voltage of the signal as a function of<br />
time, much as we might draw on a sheet of graph paper. We will spent the first portion of today’s<br />
lab learning how to use the oscilloscope <strong>and</strong> how to measure timing <strong>and</strong> voltage information<br />
directly from the screen.<br />
<strong>The</strong> oscilloscope is a powerful tool, but our primary concern is to use it to help us visualize <strong>and</strong><br />
underst<strong>and</strong> alternating current (<strong>AC</strong>) circuits. This will involve some concepts that you are<br />
probably still covering concurrently in the lectures <strong>and</strong> recitations, so we will only cover very<br />
basic ideas in this lab. You are already familiar with Ohm's Law: for an ohmic resistor, V = iR.<br />
This relationship is valid for the voltage V <strong>and</strong> current i at any given instant in time, <strong>and</strong> could<br />
tell us the current which flows through a known resistance R when connected to a given voltage<br />
supply V. In direct current (DC) circuits, the current <strong>and</strong> voltage do not change with time. In an<br />
<strong>AC</strong> circuit, however, we typically apply a periodic signal, the simplest of which is sinusoidal:<br />
V V 0<br />
sin( t)<br />
.<br />
Note that ω is the angular frequency (measured in radians per second), <strong>and</strong> is related to the<br />
oscillation frequency f by ω = 2π f.
If we applied this sinusoidal voltage source to a resistor, then Ohm’s law would tell us that the<br />
current through the resistor at any instant of time would be given by<br />
V V0<br />
i sin( t)<br />
I<br />
0<br />
sin( t)<br />
.<br />
R R<br />
Note that every time the voltage V reaches a maximum, the current i reaches a maximum. <strong>The</strong><br />
same is true for the voltage <strong>and</strong> current reaching zero or a minimum. We then say that, for a<br />
resistor, the voltage <strong>and</strong> current are "in phase." Note also that Ohm’s law relates the amplitudes<br />
V 0 <strong>and</strong> I 0 .<br />
This behavior is not the same for a capacitor or an inductor when connected to a sinusoidal<br />
voltage source. This is because the voltage <strong>and</strong> current in these devices are related to each other<br />
through a time derivative. For instance, the voltage across an inductor is proportional to the rate<br />
of change of current (di/dt) <strong>and</strong> not simply to i. For inductors <strong>and</strong> capacitors, the voltage <strong>and</strong><br />
current are not in phase. You will learn, in fact, that for a single inductor or a single capacitor<br />
connected to a sinusoidal source, the current <strong>and</strong> voltage are 90° out of phase. In other words,<br />
when V reaches a maximum or minimum, i is zero <strong>and</strong> vice-versa. For a capacitor, the current i is<br />
90° ahead of the voltage, <strong>and</strong> in an inductor, the current is 90° behind the voltage. <strong>The</strong><br />
amplitudes I 0 <strong>and</strong> V 0 are related to each other by something that sort of looks like Ohm's Law:<br />
V<br />
0<br />
I<br />
0<br />
V0<br />
I<br />
0<br />
X<br />
C<br />
<br />
C<br />
I X I ( L)<br />
0<br />
L<br />
0<br />
for a capacitor<br />
for an inductor<br />
(Eq. 1)<br />
Note that the quantity that looks like a "resistance" (technically called a "reactance") changes<br />
with frequency! From Eq. 1, we can see that a capacitor acts like it has a high reactance at low<br />
frequencies <strong>and</strong> a low reactance at high frequencies, while for an inductor it's the other way<br />
around.<br />
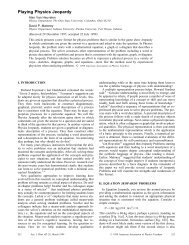
Today's lab will focus on a "series RLC" circuit in which we connect a resistor, a capacitor <strong>and</strong><br />
an inductor in series with a sinusoidal voltage. (We will use the oscilloscope to observe what<br />
happens as we vary the frequency of the driving voltage). <strong>The</strong> circuit is as shown below:<br />
R<br />
V = V 0 sin(ωt)<br />
C<br />
Figure 1 A series RLC circuit, in which a sinusoidal voltage source V, drives a current through a resistor R, an<br />
inductor L <strong>and</strong> a capacitor C.<br />
L
For a series RLC circuit, the amplitude of the current is given by<br />
V<br />
0<br />
, (Eq. 2)<br />
Z<br />
I<br />
0<br />
where Z is known as the impedance of the circuit (measured in units of ohms), <strong>and</strong> is given by<br />
Z R ( X X ) , (Eq. 3)<br />
2 2<br />
L C<br />
At any frequency, the resistance R will always remain constant. <strong>The</strong> reactances due to the<br />
inductor <strong>and</strong> the capacitor (X L <strong>and</strong> X C , respectively), will however vary according to the<br />
frequency of the driving voltage. In Eq. 1, we can see that the reactances of the inductor <strong>and</strong> the<br />
capacitor vary in different ways with respect to the driving frequency. It st<strong>and</strong>s to reason, then,<br />
that there must be some frequency at which the two reactances exactly balance. At this special<br />
frequency, known as the resonant frequency, we can see that the circuit’s impedance would<br />
reach a minimum, <strong>and</strong> thus the current amplitude in the circuit would reach a maximum.
Name: ____________________________<br />
Name: ____________________________<br />
Name: ____________________________<br />
Date: ______________<br />
<strong>Lab</strong> Sect.: __________<br />
<strong>Lab</strong> Instructor: ______________________<br />
Directions:<br />
In this lab, you are provided with a Tektronix 2213 oscilloscope. <strong>The</strong> front panel of this<br />
instrument is divided up into six areas:<br />
To the far left is the cathode ray tube (CRT) display.<br />
<strong>The</strong> next vertical strip contains 6 items, including the power button.<br />
<strong>The</strong> next two areas contain controls related to the vertical deflection of the electron beam<br />
(Channel 1 <strong>and</strong> Channel 2).<br />
<strong>The</strong> last two areas on the right contain controls for the horizontal deflection of the<br />
electron beam, including a time base control for determining the rate at which the<br />
electron beam will sweep across the display <strong>and</strong> the trigger controls for timing this<br />
sweep.<br />
Before turning the power on, check that the following knobs are in the indicated positions:<br />
1. Auto intensity: turn counterclockwise fully.<br />
2. <strong>The</strong> three "position" knobs — Channel 1, channel 2 <strong>and</strong> horizontal -- pointing up.<br />
3. Vertical mode switches: Channel 1<br />
4. Horizontal mode switch: no dly ("no delay")<br />
5. sec/div: 2 ms (2 millisecond/cm)<br />
6. Trigger mode: Auto<br />
Now, push the power switch on. Turn the "Auto Intensity" switch slowly clockwise. You should<br />
see a line appear on the screen. Keep the intensity at the minimum level required for you to<br />
clearly see the line. Prolonged operation at very high intensities can damage the phosphor screen.<br />
If you do not see a line:<br />
<br />
<br />
Check whether the scope is plugged in.<br />
If the scope is plugged in, push the "beam find" button briefly. This should show you that<br />
the beam is being deflected in a particular direction but is off the screen. You can bring<br />
the beam back by using the "position" knobs.
<strong>Lab</strong> Activity 1: Using the oscilloscope as a DC voltmenter<br />
Your scope should already have a co-axial cable connected to the "Ch 1" input. <strong>The</strong> red<br />
connecting wire will be connected to the positive end of any voltage you want to<br />
measure, while the black connecting wire will be connected to the negative (ground)<br />
terminal. In general, it is important to keep to this convention to avoid potentially serious<br />
short circuits!<br />
Note the red knob that is part of the "CH 1 Volts/div" control knob. Gently turn this red<br />
knob back <strong>and</strong> forth to get a feel for how it works. <strong>The</strong>n, turn it clockwise as far as it will<br />
go <strong>and</strong> make sure that it clicks in place. <strong>The</strong> Channel 1 input is now "calibrated" so that<br />
the numbers on the "volts/div" scale are meaningful! Anytime you use a scope, always<br />
check that the different scale knobs are in the calibrated position!<br />
Now calibrate the time control knob (labeled sec/div). Some of the time dials on the<br />
scopes are mislabeled; if your scope’s time knob has more than one position labeled the<br />
same thing, consult your TAs for what the labels should be.<br />
Connect the red <strong>and</strong> black ends of the cable to each other to provide a clear input of 0 V.<br />
Adjust the Ch 1 controls as follows:<br />
o Position: adjust this so that the horizontal line is in the center of the display.<br />
o Volts/div: set this to "1" on the 1× side (left side) of the dial. This means that<br />
every vertical displacement of 1 cm (major division on the display scale)<br />
corresponds to 1 V. (Throughout this lab you should adjust this setting as<br />
necessary to obtain more accurate measurements)<br />
o <strong>AC</strong>-GND-DC switch for CH 1: set this at DC.<br />
Now connect a 1.5-V battery across the scope input, with the black connector to the<br />
"negative" terminal <strong>and</strong> the red connector to the "positive" terminal.<br />
Note down the vertical deflection of the display line. Try to set the "volts/div" dial to a<br />
value that will give you the most accurate reading.<br />
Repeat the above with the two batteries in series.<br />
Q1. Write down the readings you obtained above.<br />
volts/div<br />
Single battery<br />
vertical deflection [cm]<br />
voltage [V]<br />
volts/div<br />
Two batteries in series<br />
vertical deflection [cm]<br />
voltage [V]
<strong>Lab</strong> Activity 2: Using the scope to measure the amplitude <strong>and</strong> frequency of a periodic<br />
voltage signal<br />
Now, it's time to learn how the scope can be used to measure a voltage signal that varies with<br />
time. We'll be using a signal that is provided by the Science Workshop interface box.<br />
<br />
<br />
<br />
<br />
<br />
<br />
<br />
<br />
<br />
First, make sure that there is a pair of wires that are connected to the Science Workshop<br />
interface box at the "output" banana plug outlets (extreme right).<br />
Connect the scope leads to the output leads from the interface box, making sure you<br />
connect the black lead to ground <strong>and</strong> the red one to the positive output.<br />
Set the scope "CH 1 VOLTS/DIV" controls to measure 1 volt/div.<br />
Set the "sec/div" knob to "5 ms." Make sure the central red knob is in the calibrated<br />
position.<br />
Open DataStudio (start → Programs → Physics → DataStudio), <strong>and</strong> click on Create<br />
Experiment.<br />
Click on the Output icon (yellow circle) located on the right side of the picture of the<br />
Science Workshop interface box in the main Experiment Setup window.<br />
o From the pull-down menu, select the Sine Wave output.<br />
o Set the Amplitude to 1.000 V.<br />
o Set the Frequency to 100 Hz.<br />
o Click the On button. (If you cannot click On because it is not selectable, make<br />
sure Auto is not selected.)<br />
Observe the oscilloscope display. You should see a sine wave. Discuss amongst your<br />
group how the pattern on the screen is quantitatively related to the frequency of the input<br />
signal.<br />
Try turning the "sec/div" knob to different values <strong>and</strong> observe how the display changes.<br />
Try varying the frequency of the DataStudio output signal from 30 Hz to 300 Hz.<br />
Observe how the oscilloscope display changes <strong>and</strong> use the "sec/div" knob to keep the<br />
display at a convenient scale. Does changing this setting change the frequency of the<br />
signal?<br />
Q2. Suppose you want to measure the frequency of a periodic input signal using the scope.<br />
Describe how you would go about doing this, i.e., write down a relationship between the<br />
frequency f of the signal, the setting on the "sec/div" scale, <strong>and</strong> the size of the pattern on the<br />
scope’s grid (“size of the pattern” means either the horizontal or vertical properties of the<br />
waveform, it is up to you to decide which).
<strong>Lab</strong> Activity 3: Using the oscilloscope to analyze a series RLC circuit<br />
Now for a real circuit measurement! You have been provided with a circuit board that contains a<br />
number of different components connected together. <strong>The</strong> large white coil is the inductor. To<br />
increase its inductance, remove the metal rod that is held on the circuit board <strong>and</strong> place it<br />
vertically in the inductance coil. Notice that on this pre-fabricated circuit board, a white line<br />
between components indicates the presence of a conducting wire connecting those components.<br />
<br />
Select the output of the Science Workshop interface box to have an amplitude of 1 V <strong>and</strong><br />
a frequency of 300 Hz.<br />
<strong>The</strong>n, connect the output of the interface box across a series combination of the 10-Ω<br />
resistor, the inductor <strong>and</strong> the 100-μF capacitor. (Essentially, one lead goes to the free end<br />
of the resistor <strong>and</strong> the other goes to the free end of the capacitor, with the other<br />
connections already taken care of on the board itself.)<br />
<br />
Making sure that you keep the polarities right, connect the input leads of the oscilloscope<br />
across the 10-Ω resistor.<br />
Note: Both the black lead of the oscilloscope <strong>and</strong> the black lead of the output from the Science<br />
Workshop interface are hooked internally to a common “ground”. If these leads are not<br />
connected to the same point in your circuit, then the circuit is connected to ground (V = 0) at two<br />
different points <strong>and</strong> you will not be measuring what is intended. If this is the case, rearrange your<br />
circuit so as to have the black leads connected together, with the output of the interface box<br />
applied across the series combination <strong>and</strong> the oscilloscope arranged to measure the voltage<br />
across the resistor.<br />
Recall that the resistor is an ohmic device, <strong>and</strong> so the voltage across the resistor is always<br />
proportional to the current through the resistor. We will use this to determine at what frequency<br />
the current amplitude reaches its maximum. So, your goal will be to measure the amplitude of<br />
the voltage across the resistor as a function of frequency of the output voltage.<br />
<br />
Vary the frequency down from 300 Hz to 30 Hz, measuring the amplitude of the voltage<br />
at every frequency in Table 1. You will have to adjust both the "sec/div" horizontal scale<br />
as well as the "volts/div" vertical scale as you go through this measurement.<br />
Q3. Using an Excel spreadsheet, plot the voltage amplitude versus frequency. Include a printout<br />
of the graph with your lab report.<br />
Q4. At approximately what frequency is the voltage amplitude a maximum? (Again, this is<br />
known as the "resonant frequency" of the circuit.)<br />
Resonant frequency: _______________________
Driving<br />
Frequency f<br />
[Hz]<br />
300<br />
250<br />
225<br />
200<br />
175<br />
150<br />
125<br />
100<br />
90<br />
80<br />
70<br />
60<br />
50<br />
45<br />
40<br />
35<br />
30<br />
Resistor Voltage<br />
Amplitude<br />
[V]<br />
Table 1 Measured voltage amplitude across resistor in a series RLC circuit as a function of driving frequency<br />
Q5. We saw in the introduction that the impedance Z is a minimum at this particular "resonant"<br />
frequency. Based on the expression for the impedance Z in Eq. 3 <strong>and</strong> the condition described<br />
above, derive a relationship between the resonant angular frequency ω 0 , the capacitance C, <strong>and</strong><br />
the inductance L. Be sure to show how you arrived at your result.<br />
Use this relationship <strong>and</strong> the value of C = 100 μF to deduce the value of the inductance L.
Q6. Now, we will investigate the effect of the iron bar on has on the circuit. Set the frequency<br />
to one much lower than the resonance frequency you found above. Observe the pattern with the<br />
iron bar in the inductor <strong>and</strong> then remove the bar. Next, set the frequency to one much higher<br />
than the resonance frequency you found above. Again, observe the pattern with the iron bar in<br />
the inductor <strong>and</strong> then remove the bar. What change occurred at each frequency when you<br />
removed the iron bar? For which frequency was the change more pronounced? Why would the<br />
change be more pronounced for this frequency?