Understanding RL Circuits (Lab 9)
Understanding RL Circuits (Lab 9)
Understanding RL Circuits (Lab 9)

You also want an ePaper? Increase the reach of your titles
YUMPU automatically turns print PDFs into web optimized ePapers that Google loves.
Goals:<br />
<br />
<br />
<br />
<strong>RL</strong> <strong>Circuits</strong><br />
To quantify the rate at which the potential difference across an inductor changes when<br />
connected in series with a resistive element.<br />
To discuss differences in the behaviors of a circuit with only a resistive element, a circuit<br />
with a capacitor in series with a resistive element, and a circuit with an inductor and a<br />
resistive element.<br />
To practice linearization of data as a data-analysis technique.<br />
Equipment:<br />
<br />
<br />
<br />
<br />
<br />
<br />
<br />
<br />
<br />
<br />
Science Workshop Interface<br />
Voltage Probes<br />
Digital Multimeter (DMM)<br />
Phys212 <strong>Lab</strong>Kit Module<br />
<strong>RL</strong>C circuit board<br />
5 and Diode Circuit board<br />
High inductance coil<br />
(7) Stackable banana-plug connecting wires<br />
(4) Alligator connecting wires<br />
Software: Microsoft Excel, DataStudio<br />
Introduction:<br />
In an earlier lab, we examined how capacitors and resistors interact in a circuit. In this lab, we<br />
will study how indutors and resistors interact in a circuit (called an <strong>RL</strong> Circuit). We will<br />
approach this qualitatively and then quantitatively.<br />
Due to Faraday’s Law, inductors oppose changes in the current through them. Any change in<br />
current changes the magnetic field created by the inductor which means that the magnetic flux<br />
through the inductor changes. This change in flux induces an EMF to oppose the change. The<br />
induced EMF, induced , of an inductor is given by:<br />
di<br />
<br />
induced<br />
L<br />
(Eq. 1)<br />
dt<br />
di<br />
where L is inductance, and i is the current through the inductor (so is the rate of change of the<br />
dt<br />
current). The negative sign comes from the fact that this induced EMF creates a magnetic field<br />
which opposes the change in flux. A capacitor’s capacitance depends how it was made (i.e. size<br />
/ shape of the terminals, how they are separated, what material is between them), and a resistor’s<br />
resistance depends how it was made (i.e. what material it was made of and what shape it is). The<br />
inductance of an inductor is given by:<br />
<br />
B<br />
N L B-one<br />
(Eq. 2)<br />
i i
PHYS 212 <strong>Lab</strong> <strong>Understanding</strong> <strong>RL</strong> <strong>Circuits</strong> 2<br />
where B is the magnetic flux through the inductor. This magnetic flux is the flux created<br />
through the inductor by the current which passes through it (this is why inductance is more<br />
properly called “self-inductance”). The inductors we encounter are often made of many turns of<br />
wire and so it can be useful to note that the magnetic flux could be looked at as the magnetic flux<br />
created by one turn of wire ( B-one ) multiplied by the number of turns of wire (N) making the<br />
inductor. In other words, the more turns of wire an inductor has, the larger its inductance will be.<br />
The inductance can also be increased by placing a ferromagnetic material within the center of the<br />
inductor. The magnetic field created by the inductor in the current will magnetize this core; as<br />
the inductor’s magnetic field changes so will the magnetization of the core. This in turn will<br />
correspond to a larger change in flux.<br />
When an inductor is connected in series with a resistor of resistance R and a power supply or<br />
battery with EMF , the inductor will oppose any change in flux (by trying to keep the current at<br />
its initial value, zero). This will cause the voltage across the inductor to spike. The voltage<br />
across the inductor then decays with time. As the inductor opposes the change in current, the<br />
current will increase rapidly at first, then the rate at which the current changes will decrease as it<br />
eventually reaches a final steady-state value. This process is described by the equations<br />
<br />
<br />
<br />
t<br />
i t 1 e <br />
<br />
<br />
(Eq. 3)<br />
R <br />
and<br />
V<br />
L<br />
t<br />
<br />
t<br />
<br />
e<br />
(Eq. 4)<br />
As with an RC circuit, the quantity t is called the time constant of the circuit. For an <strong>RL</strong> circuit,<br />
the time constant is given by<br />
L<br />
<br />
(Eq. 5)<br />
R<br />
If an inductor has a current through it and then is removed from the battery in such a way that it<br />
is still connected to a resistance R, the inductor will still oppose any change in flux (by trying to<br />
keep the current at its initial value and direction, whatever those are). The current through the<br />
inductor will decrease rapidly but then the rate will slow as it approaches zero. This process is<br />
described by the equations<br />
t<br />
<br />
it<br />
e<br />
(Eq. 4)<br />
R<br />
and<br />
V<br />
L<br />
t<br />
<br />
t<br />
<br />
e<br />
(Eq. 5)
PHYS 212 <strong>Lab</strong> <strong>Understanding</strong> <strong>RL</strong> <strong>Circuits</strong> 3<br />
Name: ____________________________<br />
Name: ____________________________<br />
Name: ____________________________<br />
Date: ______________<br />
<strong>Lab</strong> Sect.: __________<br />
<strong>Lab</strong> Instructor: ______________________<br />
Directions:<br />
<strong>Lab</strong> Activity 1: Charging and Discharging of <strong>RL</strong> Circuit<br />
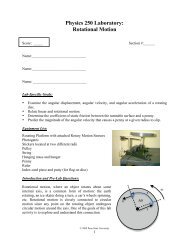
Construct the circuit shown in Figure 1 below. Make sure that you connect the batteries<br />
to each other with the correct polarities (i.e., the positive end of one battery connected to<br />
the negative terminal of the second battery). The resistor in the circuit is the round bulb<br />
on the same circuit board as the switch. The switch has two possible closed positions,<br />
labeled A and C. Position A requires the switch to be held to keep it closed. Because we<br />
do not want to accidentally leave the batteries connected to the circuit, in this lab, we will<br />
only use position A. Also make sure that the light bulbs are properly screwed into their<br />
sockets.<br />
A<br />
B<br />
C<br />
Figure 1 A circuit with two batteries and a light bulb. Please ask your teaching assistants if you<br />
are unsure about your wiring of the circuit.<br />
<br />
Throw the switch to A for a few moments and observe the light bulb. Throughout this<br />
lab, wait at least thirty seconds between runs to ensure that the light bulb cools.<br />
Q1. What happens to the light bulb when the switch is thrown to A (this is not a trick question,<br />
just describe what happens)?<br />
_____________________________________________________________________________<br />
_____________________________________________________________________________<br />
_____________________________________________________________________________
PHYS 212 <strong>Lab</strong> <strong>Understanding</strong> <strong>RL</strong> <strong>Circuits</strong> 4<br />
Q2. What happened to the light bulb in an RC circuit (look back at “<strong>Understanding</strong> RC <strong>Circuits</strong>”<br />
if you can’t recall)?<br />
_____________________________________________________________________________<br />
_____________________________________________________________________________<br />
_____________________________________________________________________________<br />
.<br />
<br />
<br />
<br />
<br />
<br />
<br />
<br />
Open DataStudio (start → Programs → DataStudio → DataStudio), and click on<br />
Create Experiment.<br />
Click on Add Sensor or Instrument.<br />
Select Voltage Sensor<br />
Click and drag the Graph icon onto the Voltage Sensor icon.<br />
Click and drag the Table icon shown above to Voltage Sensor icon.<br />
You should feel free to arrange the displays as you see fit. After doing this, your screen<br />
should display the Graph and Table display.<br />
Change the sample rate for the Voltage Sensor from 10 Hz to at least 4,000 Hz. The<br />
changes we will record have a very short time scale; the Science Workshop 750 Interface<br />
has a maximum sample rate of 250,000 Hz when using a single analog sensor.<br />
<br />
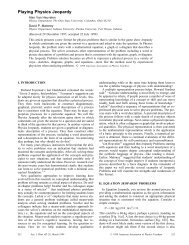
Modify the circuit to be the one shown in Figure 2 below. One of the two inductors, is on<br />
the “<strong>RL</strong>C Circuit” board and the other is the “High Inductance Coil” attached to the<br />
wooden board. Some things to keep in mind while you are constructing this circuit:<br />
o The <strong>RL</strong>C Circuit board has wires embedded in it (the white lines show where they<br />
are). To connect the inductor (the spool of wire), insert one banana plug wire into<br />
the socket on either side of the inductor. Remove the metal bar from the <strong>RL</strong>C<br />
Circuit board and insert it into the center of the inductor. This will increase its<br />
inductance.<br />
o To ensure a good connection for the High inductance coil, connect an alligator<br />
clip to both of the two brass posts sticking out of the wooden board. Connect the<br />
other ends of the alligator clips’ wires to banana plugs to be used with the circuit<br />
boards.<br />
o Do NOT close the circuit yet (i.e., leave the switch in the open position B).
PHYS 212 <strong>Lab</strong> <strong>Understanding</strong> <strong>RL</strong> <strong>Circuits</strong> 5<br />
A<br />
B<br />
C<br />
Figure 2 An <strong>RL</strong> charging circuit. Please ask your teaching assistants if you are unsure about your wiring of the<br />
circuit.<br />
Q3. Why have we asked you to connect the two inductors in series like this? Things to consider<br />
to help answer this: What should connecting the inductors in series do to the total inductance<br />
and why (with physical reasoning, not just quoting an equation)? Why might we want to make<br />
that effect to the total inductance (look back at the <strong>RL</strong> circuit equations)?<br />
_____________________________________________________________________________<br />
_____________________________________________________________________________<br />
_____________________________________________________________________________<br />
_____________________________________________________________________________<br />
_____________________________________________________________________________<br />
_____________________________________________________________________________
PHYS 212 <strong>Lab</strong> <strong>Understanding</strong> <strong>RL</strong> <strong>Circuits</strong> 6<br />
Q4. Predict what will happen to the voltage across the inductors after you close the switch to A<br />
and then release the switch. Sketch (qualitatively) below what you expect the time variation of<br />
the voltage to look like including what should happen after the switch is released. <strong>Lab</strong>el the point<br />
at which you would release the switch from A. (Alternatively, you can make a graph using Excel<br />
and attach it to your lab report, if you so wish.) Explain why you drew those forms.<br />
DV L<br />
t<br />
_____________________________________________________________________________<br />
_____________________________________________________________________________<br />
_____________________________________________________________________________<br />
_____________________________________________________________________________
PHYS 212 <strong>Lab</strong> <strong>Understanding</strong> <strong>RL</strong> <strong>Circuits</strong> 7<br />
Q5. Now, actually throw the switch to A for a few moments and observe the light bulb.<br />
Describe (qualitatively) what happens to the light bulb when you move the switch to position A<br />
(including any differences between this circuit and the one with only a light bulb or an RC<br />
circuit).<br />
_____________________________________________________________________________<br />
_____________________________________________________________________________<br />
_____________________________________________________________________________<br />
_____________________________________________________________________________<br />
_____________________________________________________________________________<br />
_____________________________________________________________________________<br />
<br />
<br />
<br />
Connect the voltage probes to measure the voltage V L across the inductors.<br />
Click on the Start button in DataStudio to begin recording data, and close the circuit by<br />
moving the switch to position A.<br />
o When a steady state has been reach, release the switch<br />
o When a new steady state has been reached, stop recording data by clicking the<br />
Stop button in DataStudio.<br />
You might wish to do this a few times in order to get a reasonable set of data. Note that<br />
you can delete any set of data simply by highlighting the name of the data set in the Data<br />
window and then pressing the Delete key.
PHYS 212 <strong>Lab</strong> <strong>Understanding</strong> <strong>RL</strong> <strong>Circuits</strong> 8<br />
Q6. Sketch (qualitatively) the time variation of the measured voltage across the inductors. <strong>Lab</strong>el<br />
the point at which you released the switch from A. (Alternatively, you can print the graph and<br />
attach it to your lab report, if you so wish.) Make sure your graph includes what happened after<br />
the switch was released. If some parts of the behavior, have different time scales than others,<br />
you should include multiple graphs (one for each section of the behavior).<br />
DV L<br />
t<br />
Q7. Discuss any differences between your graph from Data Studio (Q6) and your initial sketch<br />
(Q4). What might have caused them (explain at least one difference between the two graphs; if<br />
there are no differences, then be sure you completely explained all of the features you predicted<br />
above in Q4)?<br />
_____________________________________________________________________________<br />
_____________________________________________________________________________<br />
_____________________________________________________________________________<br />
_____________________________________________________________________________<br />
_____________________________________________________________________________<br />
_____________________________________________________________________________
PHYS 212 <strong>Lab</strong> <strong>Understanding</strong> <strong>RL</strong> <strong>Circuits</strong> 9<br />
Q8. As a reminder, here is what the voltage across a charging and then discharging capacitor<br />
looked like (from the lab “<strong>Understanding</strong> RC <strong>Circuits</strong>”):<br />
DV C<br />
Start Discharging<br />
t<br />
Qualitatively compare and contrast this and what you observed for the inductor. Explain any<br />
differences or similarities. (Hint: Since the inductor opposes changes in current, when it is first<br />
connected, what does it act like? When it is connected for a long time, what does it act like?)<br />
_____________________________________________________________________________<br />
_____________________________________________________________________________<br />
_____________________________________________________________________________<br />
_____________________________________________________________________________<br />
_____________________________________________________________________________<br />
_____________________________________________________________________________<br />
Move the voltage probes so that you are measuring the voltage across the light bulb, V R .
PHYS 212 <strong>Lab</strong> <strong>Understanding</strong> <strong>RL</strong> <strong>Circuits</strong> 10<br />
Q10. Attach the graph of measured voltage across the bulb V R vs. t to your lab report. <strong>Lab</strong>el the<br />
point at which you released the switch from A.<br />
Q11. Explain qualitatively why the voltage across the bulb varies as observed. Explain what that<br />
means about the current through the light bulb and so your observations in Q5.<br />
_____________________________________________________________________________<br />
_____________________________________________________________________________<br />
_____________________________________________________________________________<br />
_____________________________________________________________________________<br />
_____________________________________________________________________________<br />
_____________________________________________________________________________
PHYS 212 <strong>Lab</strong> <strong>Understanding</strong> <strong>RL</strong> <strong>Circuits</strong> 11<br />
<strong>Lab</strong> Activity 2: Quantitative Analysis of an <strong>RL</strong> Circuit<br />
In this activity, we’re going to distinguish between V L-total (the total voltage across the inductors<br />
at any time), V L (the voltage across the inductors due to their inductance and a changing current),<br />
and V L - R (the voltage across the inductors due to their resistance). The three are related by:<br />
V L-total = V L + V L-R (Eq. 6)<br />
<br />
<br />
<br />
Modify (re-wire) your circuit so that the 5 resistor on the separate circuit board is used<br />
in place of the light bulb. (Since the resistor is ohmic, we won’t have to worry about any<br />
non-ohmic behavior of the light bulb.)<br />
Repeat the first experiment that you carried out earlier: i.e., record the voltage V L-total<br />
across the inductor as a function of time after you have placed the switch at A<br />
Export the measured data to an Excel spreadsheet for analysis as follows:<br />
o In the Table display, highlight the columns of data containing the time and<br />
voltage readings.<br />
o Copy this to the clipboard (Press Ctrl-C or select Copy from the Edit menu)<br />
o Open Microsoft Excel and start a new spreadsheet.<br />
o Paste (Ctrl-V) the copied data into the first two columns.<br />
o Check the units on the data columns so you can label your graphs properly<br />
Q12. Use Excel to make a graph of V L-total versus t from the point after you moved the switch to<br />
A to just before you released the switch. Remember to label the axes on your graphs correctly<br />
with proper units. Include this graph with your lab report.<br />
Q13. If we rescale the data to remove the steady state voltage (V L-R ), we’ll be able to find the<br />
time constant fairly easily (this is making the approximation that the voltage change due to the<br />
inductors’ resistance is constant which isn’t quite right). Rescale the data and use Excel to make<br />
a graph of V L versus t just between the point when you moved the switch to A and when the<br />
steady state was reached. Remember to label the axes on your graphs correctly with proper<br />
units. Include this graph with your lab report.
PHYS 212 <strong>Lab</strong> <strong>Understanding</strong> <strong>RL</strong> <strong>Circuits</strong> 12<br />
Q14. How would you plot the data in such a way that tests whether it obeys the <strong>RL</strong> circuit<br />
equations? (Note that the easiest type of data to fit is a straight line! So, think about how to<br />
transform the equation into a form that allows you to see whether the data follows a straight line.<br />
Think logarithms! You may need to make new columns in your Excel file) Include this plot with<br />
your report. From the plot, determine the value of the time constant. Explain below how you did<br />
this and include any comments that you can about the size of the time constant. (Include your<br />
new graph.)<br />
_____________________________________________________________________________<br />
_____________________________________________________________________________<br />
_____________________________________________________________________________