Topic Maps Visualization
Topic Maps Visualization
Topic Maps Visualization

Create successful ePaper yourself
Turn your PDF publications into a flip-book with our unique Google optimized e-Paper software.
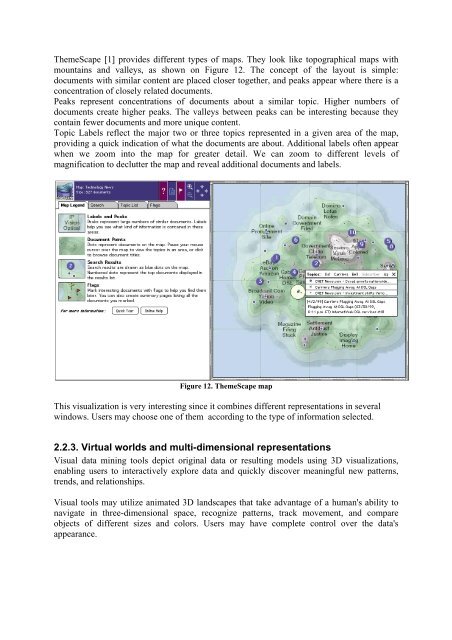
ThemeScape [1] provides different types of maps. They look like topographical maps with<br />
mountains and valleys, as shown on Figure 12. The concept of the layout is simple:<br />
documents with similar content are placed closer together, and peaks appear where there is a<br />
concentration of closely related documents.<br />
Peaks represent concentrations of documents about a similar topic. Higher numbers of<br />
documents create higher peaks. The valleys between peaks can be interesting because they<br />
contain fewer documents and more unique content.<br />
<strong>Topic</strong> Labels reflect the major two or three topics represented in a given area of the map,<br />
providing a quick indication of what the documents are about. Additional labels often appear<br />
when we zoom into the map for greater detail. We can zoom to different levels of<br />
magnification to declutter the map and reveal additional documents and labels.<br />
Figure 12. ThemeScape map<br />
This visualization is very interesting since it combines different representations in several<br />
windows. Users may choose one of them according to the type of information selected.<br />
2.2.3. Virtual worlds and multi-dimensional representations<br />
Visual data mining tools depict original data or resulting models using 3D visualizations,<br />
enabling users to interactively explore data and quickly discover meaningful new patterns,<br />
trends, and relationships.<br />
Visual tools may utilize animated 3D landscapes that take advantage of a human's ability to<br />
navigate in three-dimensional space, recognize patterns, track movement, and compare<br />
objects of different sizes and colors. Users may have complete control over the data's<br />
appearance.