Topic Maps Visualization
Topic Maps Visualization
Topic Maps Visualization

You also want an ePaper? Increase the reach of your titles
YUMPU automatically turns print PDFs into web optimized ePapers that Google loves.
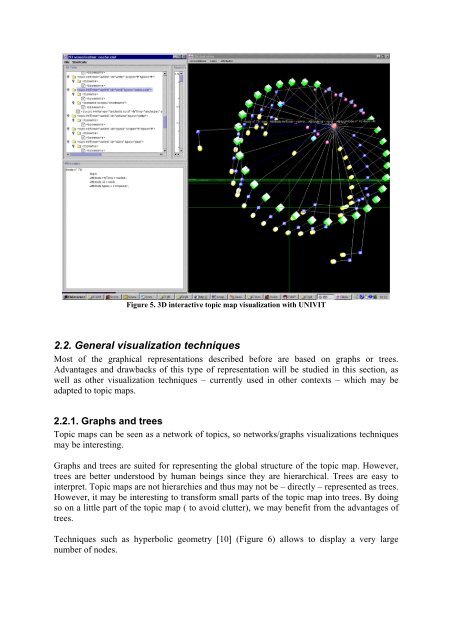
Figure 5. 3D interactive topic map visualization with UNIVIT<br />
2.2. General visualization techniques<br />
Most of the graphical representations described before are based on graphs or trees.<br />
Advantages and drawbacks of this type of representation will be studied in this section, as<br />
well as other visualization techniques – currently used in other contexts – which may be<br />
adapted to topic maps.<br />
2.2.1. Graphs and trees<br />
<strong>Topic</strong> maps can be seen as a network of topics, so networks/graphs visualizations techniques<br />
may be interesting.<br />
Graphs and trees are suited for representing the global structure of the topic map. However,<br />
trees are better understood by human beings since they are hierarchical. Trees are easy to<br />
interpret. <strong>Topic</strong> maps are not hierarchies and thus may not be – directly – represented as trees.<br />
However, it may be interesting to transform small parts of the topic map into trees. By doing<br />
so on a little part of the topic map ( to avoid clutter), we may benefit from the advantages of<br />
trees.<br />
Techniques such as hyperbolic geometry [10] (Figure 6) allows to display a very large<br />
number of nodes.