Topic Maps Visualization
Topic Maps Visualization
Topic Maps Visualization

You also want an ePaper? Increase the reach of your titles
YUMPU automatically turns print PDFs into web optimized ePapers that Google loves.
associations related to the same scope could belong to the same district. The multiple<br />
dimensions of a topic map can be represented with this metaphor.<br />
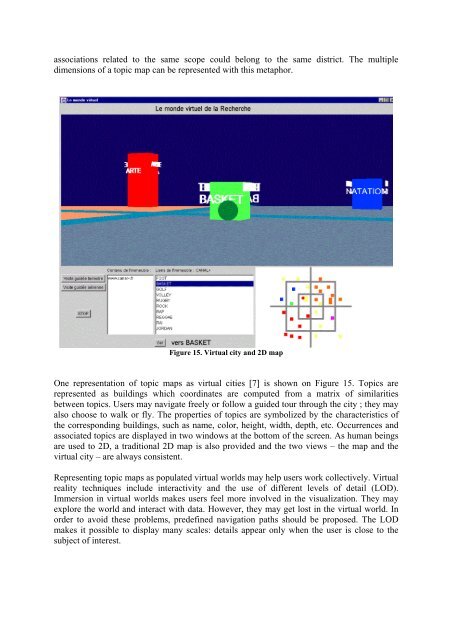
Figure 15. Virtual city and 2D map<br />
One representation of topic maps as virtual cities [7] is shown on Figure 15. <strong>Topic</strong>s are<br />
represented as buildings which coordinates are computed from a matrix of similarities<br />
between topics. Users may navigate freely or follow a guided tour through the city ; they may<br />
also choose to walk or fly. The properties of topics are symbolized by the characteristics of<br />
the corresponding buildings, such as name, color, height, width, depth, etc. Occurrences and<br />
associated topics are displayed in two windows at the bottom of the screen. As human beings<br />
are used to 2D, a traditional 2D map is also provided and the two views – the map and the<br />
virtual city – are always consistent.<br />
Representing topic maps as populated virtual worlds may help users work collectively. Virtual<br />
reality techniques include interactivity and the use of different levels of detail (LOD).<br />
Immersion in virtual worlds makes users feel more involved in the visualization. They may<br />
explore the world and interact with data. However, they may get lost in the virtual world. In<br />
order to avoid these problems, predefined navigation paths should be proposed. The LOD<br />
makes it possible to display many scales: details appear only when the user is close to the<br />
subject of interest.