Topic Maps Visualization
Topic Maps Visualization
Topic Maps Visualization

Create successful ePaper yourself
Turn your PDF publications into a flip-book with our unique Google optimized e-Paper software.
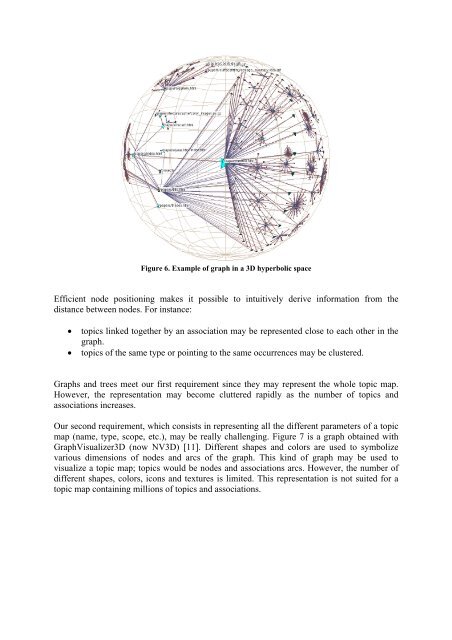
Figure 6. Example of graph in a 3D hyperbolic space<br />
Efficient node positioning makes it possible to intuitively derive information from the<br />
distance between nodes. For instance:<br />
• topics linked together by an association may be represented close to each other in the<br />
graph.<br />
• topics of the same type or pointing to the same occurrences may be clustered.<br />
Graphs and trees meet our first requirement since they may represent the whole topic map.<br />
However, the representation may become cluttered rapidly as the number of topics and<br />
associations increases.<br />
Our second requirement, which consists in representing all the different parameters of a topic<br />
map (name, type, scope, etc.), may be really challenging. Figure 7 is a graph obtained with<br />
GraphVisualizer3D (now NV3D) [11]. Different shapes and colors are used to symbolize<br />
various dimensions of nodes and arcs of the graph. This kind of graph may be used to<br />
visualize a topic map; topics would be nodes and associations arcs. However, the number of<br />
different shapes, colors, icons and textures is limited. This representation is not suited for a<br />
topic map containing millions of topics and associations.